The movement of Bitcoin from the $62,000 range to above $80,000 over a seven-day period has generated a recurring technical reading: the formation of a bull flag pattern on short-term charts. Several analytical firms have projected a $90,000 target based on the classic measurement of the pole’s height added to the breakout point.
However, the confirmation of said pattern, the probability allocation in prediction markets, and the internal structure of on-chain data impose nuances that contradict a linear interpretation of the figure.
The Bull Flag: Confirmation Conditions Not Yet Satisfied
The bull flag pattern is defined as a lateral consolidation following a pronounced impulsive move. The pole phase corresponds to the upward leg that took Bitcoin from $62,000 to $79,500. The flag phase has developed between $76,700 and $79,500, with a slightly descending or sideways slope. This structure, on the surface, meets the visual requirements of the figure.
Nevertheless, the statistical validity of the pattern requires a minimum number of touches at the upper and lower edges. Conventional technical literature considers a reliable flag to require at least three touches on each trend line to define the consolidation range. As of the close of August 24, Bitcoin had recorded only two touches on the upper edge and two on the lower, placing the figure in a state of proto-flag , rather than a confirmed flag. The distinction is not semantic: the probability of continuation following a breakout increases with the number of tests of the range, as each touch reinforces the validity of the level.
The pullback from $79,500 to $76,700 represents merely a 0.236 Fibonacci retracement , the most superficial level of the sequence. Such a shallow retracement indicates intense buying pressure, but also reduces the flag’s capacity to “cleanse” the excess leverage accumulated during the initial impulse.

The most robust continuation patterns typically show retracements to the 0.382 Fibonacci level, because they allow for a positional adjustment without breaking the bullish structure. The absence of that intermediate correction implies that any upward breakout would start from a narrow consolidation base, which increases the risk of a false breakout or a less sustainable move.
The Probability Curve on Polymarket: A Divergent Timeframe Scenario
Prediction markets offer a quantitative perspective that contrasts with technical optimism. On Polymarket, the probability assigned to Bitcoin reaching $90,000 before September 1 stands at 8%. This figure is not an isolated data point; it forms part of a gradation that shows an abrupt decline as the target rises.
For $82,500, the probability is 52%; for $85,000, 26%; and for $77,500, 70%. The structure of this curve indicates that market participants anticipate Bitcoin maintaining elevated levels, but discount a low probability of surpassing the $85,000–$90,000 barrier in the immediate horizon.
The discrepancy between the technical target of $90,000 and the implied probability of 8% does not invalidate the pattern, but it does introduce a temporal constraint. The bull flag pattern, by definition, is a short-term continuation figure; its projection is generally fulfilled within a timeframe equivalent to the duration of the pole. In this case, the pole lasted approximately five days, so the breakout and the achievement of the target should occur within a similar framework.
Prediction markets discount that such a breakout will not occur before September 1 with high confidence. This tension between technical time and the time implied in probabilistic bets is a factor that technical analysts often omit, yet it is central to evaluating the real probability of execution.
The Macro Drivers and the Short Squeeze Mechanism
The recent appreciation of Bitcoin does not occur in a vacuum. Three factors have converged synchronously:
The expansion of the U.S. Treasury’s bond buyback program, announced on August 19, raised the weekly repurchase limit for long-term bonds from $2 billion to $4 billion, effective September 9. This measure has been interpreted by traders as covert quantitative easing, given that it injects liquidity into the public debt system. The immediate effect was a depreciation of the dollar and a simultaneous flow toward non-sovereign assets, including Bitcoin and gold.
The daily correlation between Bitcoin and the dollar index turned significantly negative during the week of August 17, reinforcing the narrative that Bitcoin acts as a substitute for public debt in monetary easing environments.
During August 19 and 20, short positions exceeding $2.7 billion were liquidated across the cryptocurrency derivatives complex. The following day, an additional $1.2 billion in short liquidations occurred. This process generates a positive feedback loop: the price increase forces the closure of short positions, which in turn pushes the price higher and triggers new liquidations.
This mechanism explains the velocity of the ascent, but also implies that a significant portion of the move does not originate from new long-term demand, but from the forced covering of sellers in a short position. The sustainability of a squeeze-driven rally depends on whether genuine demand replaces the short squeeze as the primary motor.
Spot ETF flows provided an institutional demand base, during the week ending August 22, U.S. spot Bitcoin ETFs recorded net inflows of approximately $1.6 billion, the largest weekly figure since January 2026. On August 20, a daily inflow of $606 million occurred, a figure exceeding the six-month average. This flow indicates that institutional investors are allocating capital to Bitcoin as part of a tactical positioning strategy, not merely as a short-term hedge.
On-Chain Signals: Conditional Validation and Overbought Warnings
Internal network data provide objective criteria to assess whether the current rally has structural foundations. CryptoQuant’s Bull Score , a composite indicator aggregating ten on-chain metrics, jumped from 30 to 80 over seven days, with eight of the ten sub-indicators in bullish territory.
CryptoQuant classifies this phase as a “bull market initial phase”, but introduces an explicit condition: Bitcoin must close above the 365-day moving average, currently located at $83,000, to confirm the regime change. This level is not arbitrary; it coincides with the average price of the last 365 days, which has acted as support or resistance in previous cycles. A weekly close below that moving average would keep Bitcoin in a transitional zone, not in a consolidated new bull market.
The $83,000 level also aligns with the May 2026 high ($82,820), identified by Joel Kruger, strategist at LMAX Group, as the key resistance to surpass for the focus to shift toward $100,000 and the 2025 all-time highs. The confluence of the 365-day moving average and the previous peak makes this zone the most relevant technical filter for the short term.
However, the risk metrics present a less one-sided picture. The Unrealized Profit Margin of traders reached 20.5%, the highest level since June 2025. CryptoQuant has noted that, in May 2026, when this indicator reached 19%, Bitcoin experienced a 30% correction from the $82,000 level. Although history does not repeat identically, the coincidence of elevated unrealized profit levels with a high concentration of long positions often precedes profit-taking.
On August 20, short-term whales (holders with less than 155 days of tenure) realized profits of a record $614 million in a single day, and between August 20 and 22 the total exceeded $1.2 billion. The flow of Bitcoin to exchanges increased to approximately 53,000 BTC , the highest level since June. This movement indicates that a significant fraction of holders are transferring their coins to trading platforms, suggesting an intention to sell.
Resistance and Support Structure: The Level Map
On the weekly chart, immediate resistances are located at $78,600 and $82,750. Bitcoin surpassed the first on August 22, but the second, corresponding to a prior high from the bear market, has not been decisively tested. The price reached an intraday high of $81,257 on August 24, only to pull back to $79,000, confirming that the $78,600–$81,000 zone is undergoing an initial test.
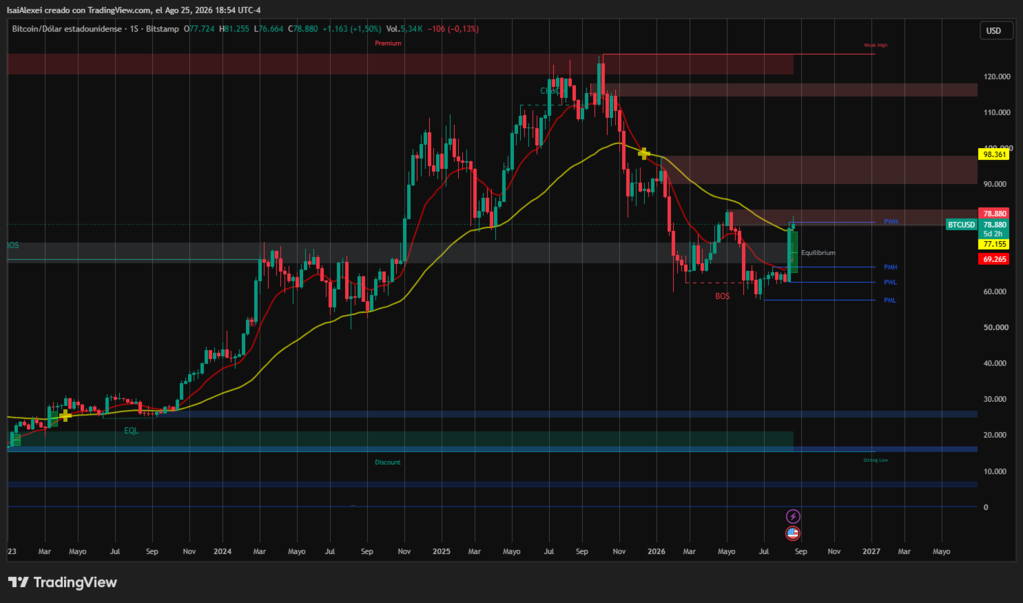
On the downside, the $69,000 level concentrates three elements: the 0.618 Fibonacci retracement of the full move from $62,000 to $79,500, the 200-day moving average (approaching that level), and a prior horizontal support. This confluence makes $69,000 the primary support point in the event of a correction. A pullback to that area would not break the medium-term bullish structure, but would imply a loss of approximately 14% from current highs.
CryptoQuant’s framework establishes that the weekly close above $83,000 is the confirmation trigger. If Bitcoin achieves that close, the $90,000 target could materialize in the following weeks, provided the flag confirms with at least three touches on both edges. If the price fails to surpass $82,750 in the coming days, the flag could degrade to a simple sideways range or even a bearish flag if the consolidation prolongs and a breakdown to the downside occurs.
Author’s Opinion: Divergence Between Technical Noise and Probabilistic Reality
The bull flag is a useful tool, but its mechanical application ignores two facts: first, that the pattern is not confirmed , and second, that the implied probability in prediction markets is inconsistent with a $90,000 target in the short term.
This inconsistency should not be interpreted as a market error, but as a signal that participants are discounting factors that pure technical analysis does not capture, such as the possibility of a correction before reaching the target, or the existence of a supply ceiling in the $82,000–$85,000 range.
The current rally has been driven primarily by short covering and by the reaction to expansive monetary policies. Both motors have a limited validity horizon: the short squeeze exhausts itself when short positions decline to normal levels, and the effect of the bond buyback has already been largely priced in.
For Bitcoin to reach $90,000, it will be necessary for institutional demand (via ETFs) and retail demand (via spot purchases) to replace those transitory drivers. ETF flow data are positive, but not sufficient by themselves; the weekly inflow of $1.6 billion represents 2.5% of the total capital managed by the ETFs, a flow that does not guarantee a breakout of the historical highs.
Moreover, the level of unrealized profit and exchange inflows suggest that short-term holders are beginning to distribute . This distribution does not necessarily imply the end of the rally, but it does add an additional layer of resistance at current levels.
A more probable scenario, in the opinion of this writer, is that Bitcoin oscillates between $76,000 and $82,000 over the coming days, accumulating a greater number of touches on the flag’s edges, and that the breakout, if it occurs, takes place toward the end of September, not before. That timing would align better with the 48% probability that Polymarket assigns to Bitcoin reaching $90,000 at some point during 2026, compared to 8% for before September 1.
The $90,000 target is achievable from a technical standpoint, but the path will not be linear
The surpassing of $83,000 on a weekly close is the necessary and sufficient condition to change the scenario. In the meantime, the market remains in a transition phase in which the bull flag figure remains a hypothesis, not a certainty.
Risk managers and professional traders should assign a lower probability to the immediate breakout scenario and pay greater attention to volume evolution and futures funding rates, which currently show a positive but not extreme funding rate, leaving room for further buying pressure without the market overheating unsustainably.
The opinion derived from this analysis is that the market should treat the $90,000 target as a favorable-case scenario, not as a baseline forecast. Position management should contemplate both the possibility of a breakout and a pullback to $69,000, and capital allocation should adjust to implied probability, not to graphical optimism.
The crypto sector has demonstrated on multiple occasions that technical patterns are useful, but that their fulfillment is not guaranteed; the convergence between price structure, on-chain data, and market expectations is the only criterion that allows for a reduction of uncertainty.
In the present case, that convergence has not yet occurred, and the price must resolve that divergence before the $90,000 target can be considered a serious possibility on the immediate horizon.