As CNBC highlights Bitcoin and how it is breeding “cults”, Tom Lee—a stickler of Bitcoin philosophy—has reasons to believe prices are prepping for a final push towards $20,000 or higher.
Technically, his assertions are not far-fetched more so when we factor the volatility of Bitcoin and most cryptocurrencies.
However, while it’s perfect for buyers, we suggest taking a neutral stand until our trade conditions are met.
Fundamentals
Bitcoin: Boom or Bust, that’s the exact title CNBC chose for their Bitcoin documentary which will air on August 27 at 6PM EST. Whether it is a thumb up or down for Bitcoin purists out there it doesn’t matter.
After all, CNBC has been known for stirring controversy in the Bitcoin and the general crypto community.
We can draw a lot of supporting evidence about their misgivings but nothing compares to their near contrarian and off price prediction as far as Bitcoin prices are concerned.
CNBC analysts are notorious for suggesting longs at peaks and shorts at bottoms often at the expense of naïve investors taking leads from a supposed authority.
At the moment though, Bitcoin enthusiasts and supporters are already throwing shed at the documentary producers not for the way the film is shot but for the persons interviewed.
Many expected leaders in the novel technology to provide insight not only on industry common jargon but on network related developments as progress of Lightning Network or Atomic Swaps, scalability solutions and less on prices because the latter is propped by many factors independent of core development.
Fundstrat Global Advisors Tom Lee is on it again—and for good reasons. In his own deductions based mainly on historical performance of price, Bitcoin is ripe for another blowing rally towards $20,000 by end this year.
While some can pour cold water on his optimism, last year and previous years can provide clues on how prices can easily glide to record prices within short spans—just from retail involvements and not Tether (USDT) links.
Bitcoin (BTC) Technical Analysis
Weekly Chart
 Uniquely, Bitcoin is the only digital asset in the top 10 most valuable list that is on the green. On a weekly basis, BTC managed to print four percent rejecting sell pressure and probably indicating an under-valuation in altcoins thanks mostly to their positive correlation and magnification tendencies.
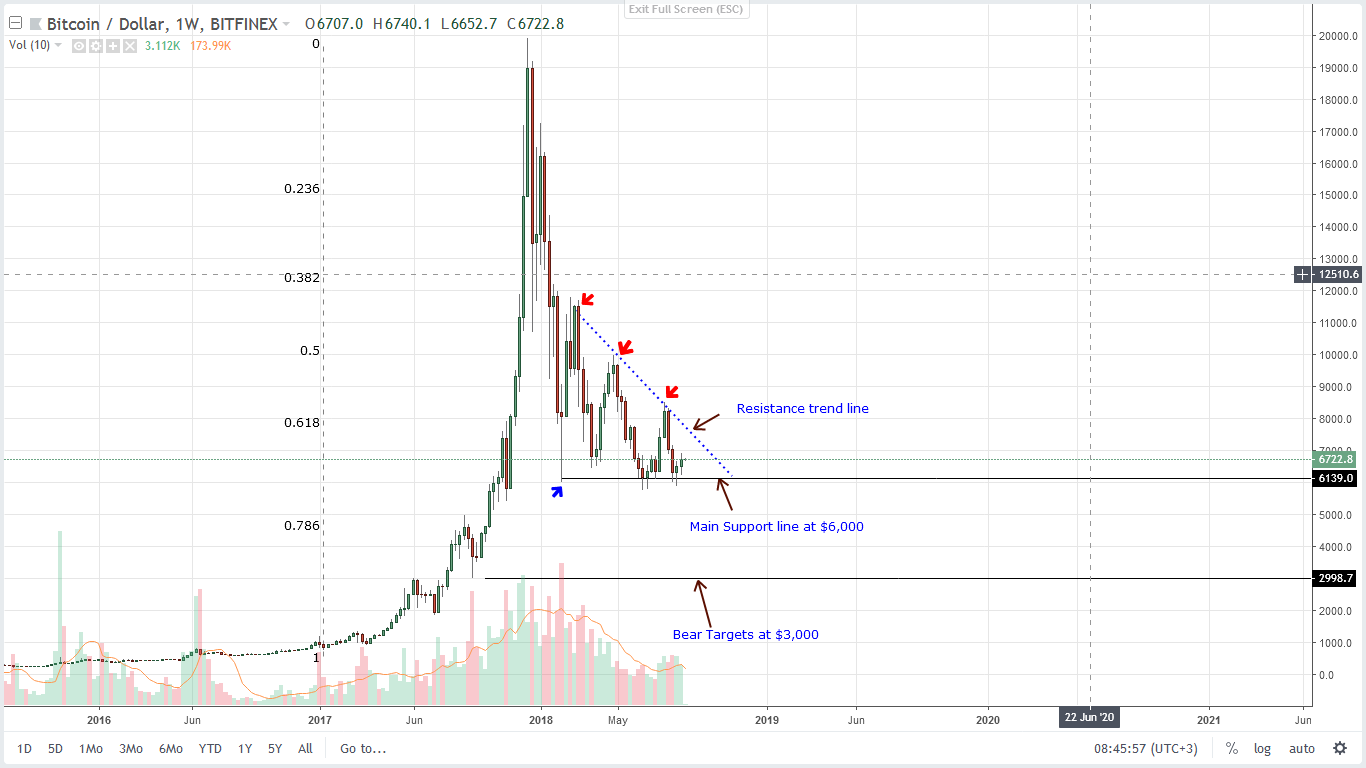
At the moment, when we take a top down approach, it’s obvious that week ending Aug 12 candlestick is important and its highs at $7,200 continues to cap gains.
From a top down approach, we are cognizant that sellers are technically in charge but for BTC bulls to build up enough momentum to warrant buys, then we must see strong, high volume surges above $7,200 on the upper side ideally closing above the main resistance trend line connecting recent highs in the weekly chart.
Daily Chart
 Considering the alignment of candlesticks, we recommend taking a neutral stance and for simple reasons.
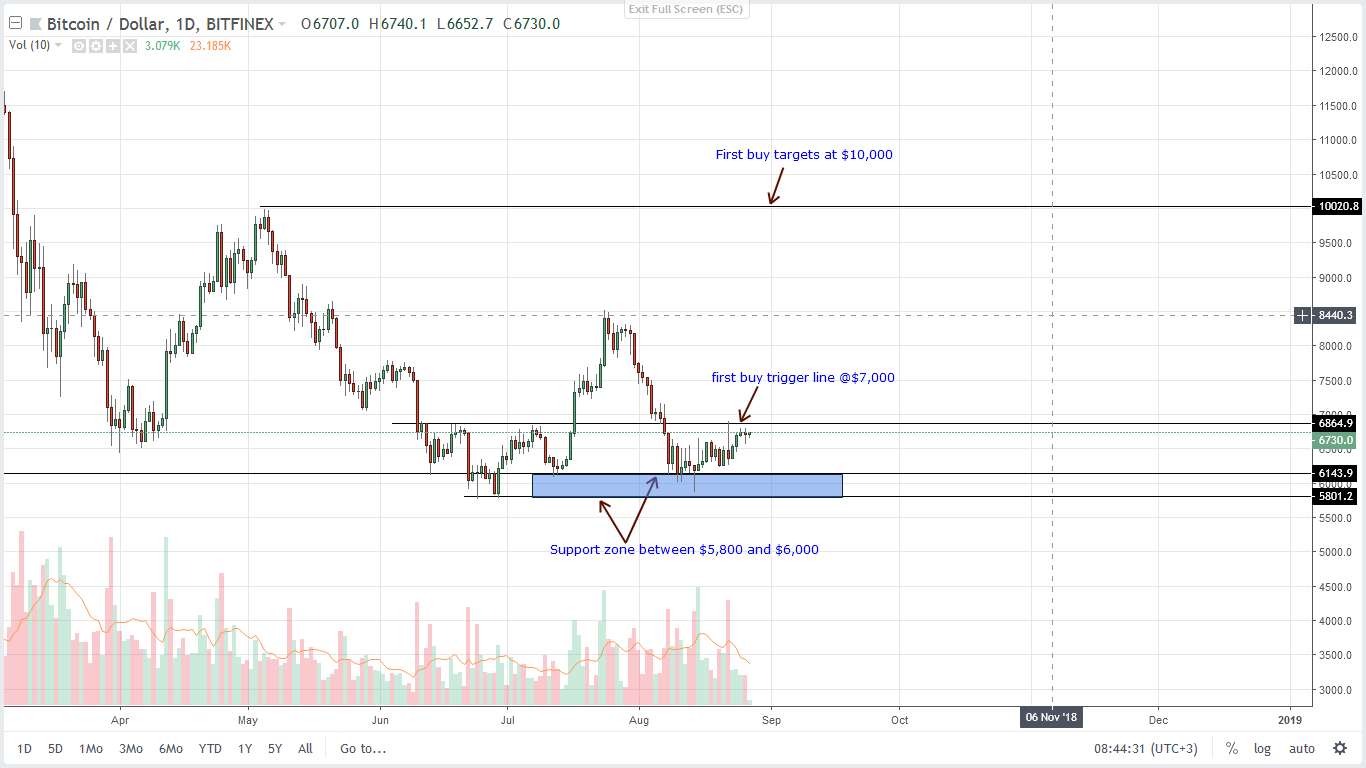
First, our important levels are at $7,000 and $7,200 as highlighted before and $5,800—2018 lows, on the lower side. At current prices, bulls have been adding their gains and what we need is a follow through that would push prices above $7,200 and Aug 12 highs triggering longs on pull backs should buyers confirm their intentions.
On the flip side, any rejection of higher highs which will see prices back towards $5,800–$6,000 support zone provides an opportunity for sellers to trade with the trend with first targets at $4,500 and later $3,000.
So, as we can judge from the way candlesticks are aligned, our trade conditions are yet to be met and taking a wait and see approach is by far a superior trade plan.
Disclaimer: This is not investment advice and views represent those of the author. Do your own Due Diligence before making investment decisions.