

Price AnalysisAnalysis
Bitcoin Revival Continues, Will BTC Steady Above $20k?
Bitcoin is bullish at spot rates, firm and could break higher. However, for the uptrend to be valid, BTC must hold above $20k.


Bitcoin is bullish at spot rates. Even so, the second half of the week has been slow for bulls, with bears showing strength.
This may be because of slowing upside momentum. In turn, this is boxing prices within a $1.1k range with identifiable caps at $20.5k and $21.6k.
Day open
$21,072
00:00 UTC
Past 7 days
+11.8%
from $18,847
Since the open
+198%
$62,706 · 18 Nov, 20:25 UTC
Record close
−68.8%
$67,526 · Nov 2021
Technically, the failure of buyers to follow through, heaping more pressure on Bitcoin on January 19, is overly bullish. Instead of prices printing lower, BTC soared, pushing the coin back above $21k and away from the immediate support at $20.5k.
Nonetheless, until there is a solid close above $21.6k, ideally $22k, for last week’s uptrend to resume, possibly triggering another wave of buying.
More Bitcoin Holders
The current trend is anchored on several on-chain and fundamental factors. After last year’s discouraging losses that saw BTC contract from as high as $70k, prices are now beginning to recover.
However, a close above November highs is necessary. As BTC bounces, most coin holders are in the green. Presently, on-chain traders show that 59 percent of all market participants are in the green. Only 38 percent are in the loss-making territory.
Meanwhile, the recent price spike has also seen the market price pierce above the realized price for the first time in over four months.
Considering how traders watch the realized price, this can be interpreted as bullish. The price can be used as a resistance and support line during analyses.
Bitcoin Price Analysis
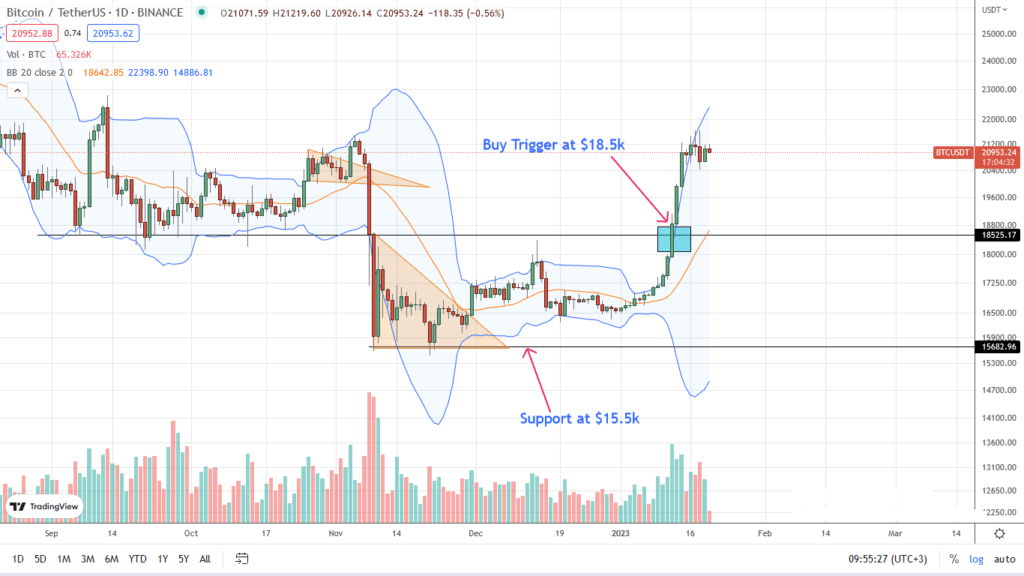
In the daily chart, the January 14 bar is important. It is a bullish engulfing bar with high trading volumes. Besides, it defines the current price action, marking resistance and support.
The immediate resistance line is at $21.5k, while support is at the bar’s lows at $20k. From an effort versus result perspective, the uptrend is valid as long as BTC prices are inside this bar.
The current consolidation inside a $21.1k trade range may be accumulated only if BTC springs above $21.5k and this week’s high. This upthrust must be with rising trading volumes. After that, Bitcoin could roar to $23k and $25k.
Conversely, losses below $20k, in alignment with January 18 bear bar and early November bearish engulfing bars, will nullify the current bullish outlook.
Technical charts courtesy of Trading View.
Disclaimer: Opinions expressed are not investment advice. Do your research.If you found this article interesting, here you can find more Bitcoin news.
Notice. For information only; not investment advice.


