The Bitcoin price is steady at the time of writing on Feb 19. The world’s most valuable digital asset is now trading above $51k, after blasting above $50k on Feb 17, going to register a new all-time high above $52k on Feb 18.
From price action, traders are upbeat, expecting more gains in the coming days.
Ahead of the pack—and joining other analysts like Anthony Pompliano and an FX analyst at Citibank, Anthony Scaramucci, in a recent interview with CNBC’s SquawkBox, said the coin is on its way to $100k.
His fund, SkyBridge Capital, in late December 2020, said it would invest $100 million in Bitcoin.
The Liquidity and Utility of Bitcoin
More firms are considering Bitcoin as a hedge against inflation. Technically, they cite the network’s store of value properties and fixed supply as properties that can absorb inflation risks.
Earlier on, Anthony Scaramucci said his fund’s failure to invest in Bitcoin was because of its low liquidity. However, with time, its depth has increased as prices and utility increase. Combined, they combine to make the digital asset attractive for investors. This, in turn, explains the influx of new investors—the latest high profile to join being Tesla.
Interestingly, within this short period of holding, the Bitcoin price has added over 50 percent, rising from around $35k, blasting above $42k—or Jan 2021 highs, to print a new all-time high of over $52.5k in mid-February 2021.
Within this holding period, Tesla has made over $750 million in profits, more than profits made from car sales.
Bitcoin Price Prediction

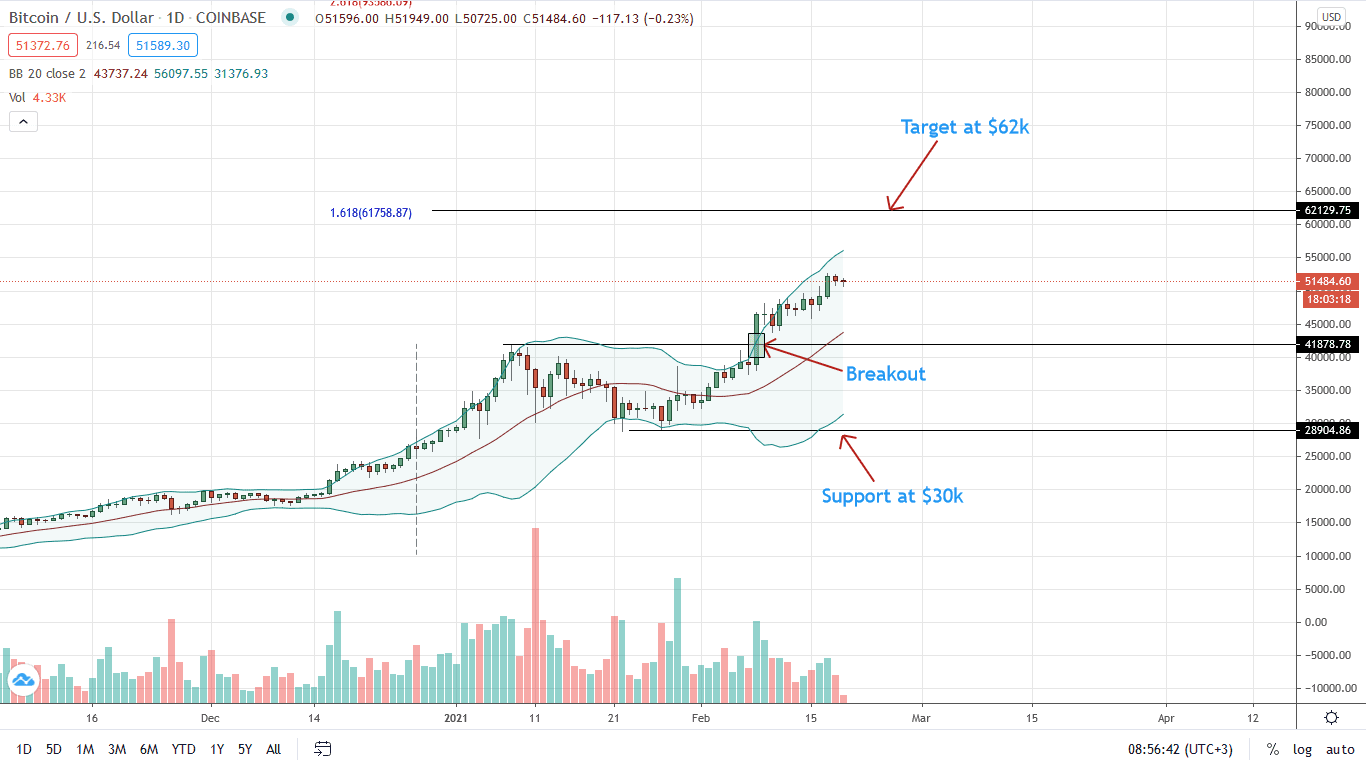
The Bitcoin price is trading within a bullish breakout pattern, candlestick arrangement in the daily chart shows.
Week-to-date, the BTC price is up eight percent, posting gains both against ETH and USD.
Despite the stagnation of Feb 18, the uptrend is firm. Every low may be an opportunity for traders targeting $62k. This flashes with the 1.618 Fibonacci extension level of Dec 2020 to Jan 2021 trade range. Note that candlesticks are also banding along the upper BB.
Accompanying the price expansion are high trading volumes, explaining the high momentum sustaining prices above the $50k round number and $42k—January 2021 highs, both of which act as support for buyers.
Sharp losses below the middle BB—the 20-day moving average and $42k, pour cold water on bullish prospects. In that case, the BTC/USD price may recoil back to $30k.
Chart Courtesy of Trading View
Disclosure: Opinions Expressed Are Not Investment Advice. Do Your Research.
If you found this article interesting, here you can find more Bitcoin news


