![Bitcoin [BTC]](https://crypto-economy.com//wp-content/uploads/2021/04/andre-francois-mckenzie-JrjhtBJ-pGU-unsplash-e1618324096656-1024x576.jpg)
The Bitcoin price is pulling back from all-time highs of $66k as of writing. This comes a few days after the SEC approval of the first Bitcoin Futures ETF.
The product, which marks the beginning of a new era, a watershed moment for crypto, was positively received on Wall Street.
Even though there were initial concerns about the quality of the instrument since, technically, the ETF tracks Bitcoin Futures—a derivative—and not the actual coin, it has directly propped BTC prices, pumping it to spot levels.
Based on solid fundamentals, traders expect the Bitcoin bulls to reaffirm themselves, standing tall in the wave of selling pressure, to climb towards $100k.
Institutionalization of Bitcoin
Possible triggers that might offer support for the leg up include the institutionalization of Bitcoin and crypto.
At present, as BTC is trudging and unable to sustain prices in new 2021 highs. Even so, the leg up of the past few months has been purely institutional-driven with minimum retail involvement.
As it seems, ordinary buyers are riding the coattails of Wall Street giants.
Tech giants like Twitter are receptive to an internet native currency, recently releasing the Tip Jar to promote BTC and monetize content.
Also, with established players like Square already holding crypto, the stage is set and the scene open for more to pour in, accumulating the coin in anticipation of the positives ahead.
Central Banks to Adopt Bitcoin?
The Former House Speaker Newt Gingrich also recently mentioned that central banks would diversify from gold to hold BTC as a reserve against inflation.
Countries should hold #Bitcoin as a hedge against inflation.
– Newt Gingrich
former US House Speaker— Bitcoin Archive (@BTC_Archive) October 21, 2021
El Salvador’s central bank already owns BTC and could be setting the base for others to follow suit.
Bitcoin Price Analysis
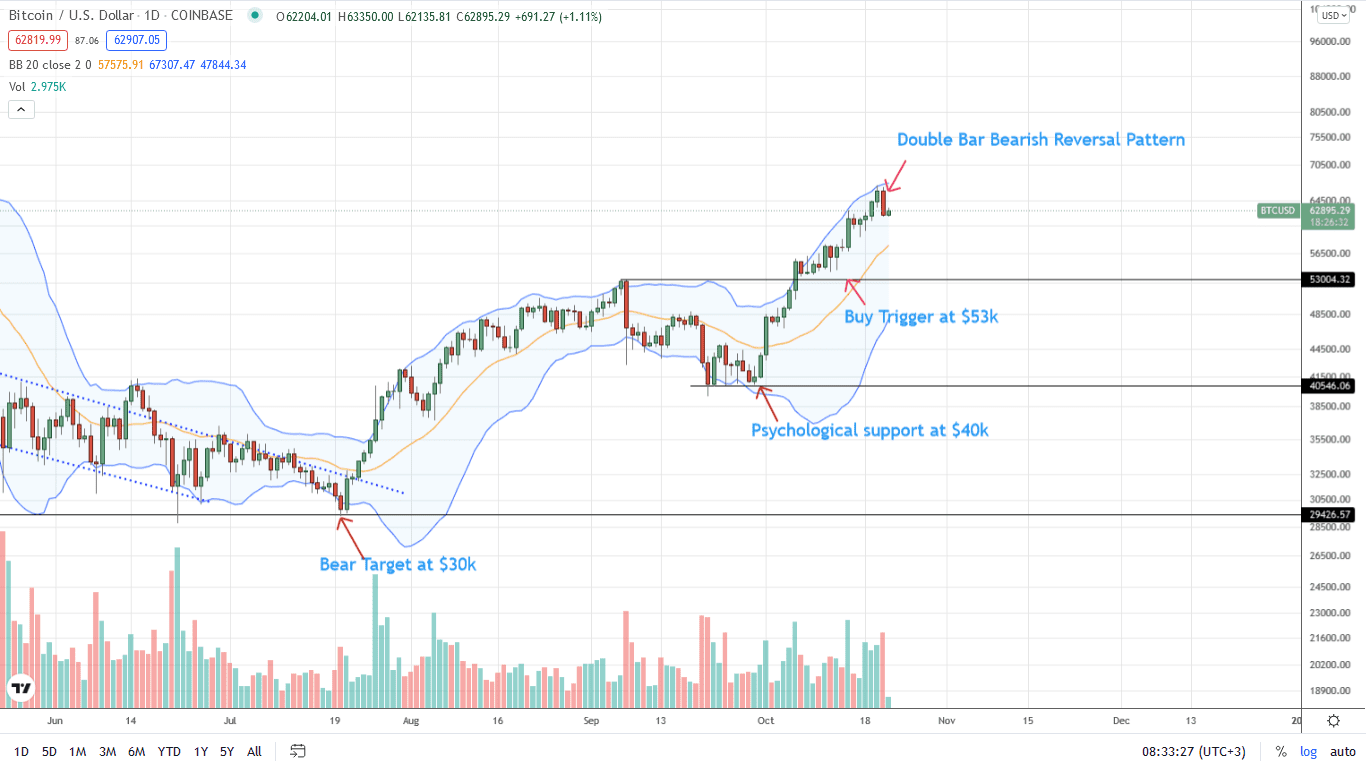
At the time of writing, BTC is free-falling versus USD, pulling back from October 20 highs. However, the path of least resistance is set and the still uptrend defined.
Even so, at the present, there is a double bar bearish reversal pattern. The October 21 bar is bearish engulfing, rewinding gains of October 20.
This formation may be due to profit taking, making the end of the FOMO of last week’s Bitcoin ETF.
In the days ahead, aggressive traders may load the dips. Nonetheless, the inability of bulls to flow back and plug the drain may nullify the uptrend, confirming October 20’s gains as a bear trap.
From the candlestick arrangement in the daily chart, BTC/USDT prices may slide back to $53k—the 38.2 percent Fibonacci retracement of the July to October 2021 trade range.
Technical charts courtesy of Trading View
Disclaimer: Opinions expressed are not investment advice. Do your research.
If you found this article interesting, here you can find more Bitcoin news