
This week the market has corrected itself in a way expected by many, but surprisingly strong for others. In general, many currencies have done something similar and have gone down. Some have done it with force and others have done it by gravity, but in general the fall in prices has been remarkable, in our weekly technical price analysis we explain this behavior in the market of the Top 10 Cryptocurrencies.
During the last days of July, the market seemed undecided and at that moment it was necessary to choose which direction to take; this week we have seen that the controversial battle over the course between bears and bulls was won by the bears, because in recent days they have caused a major debacle in the market, which for many is attractive, after having in mind the idea that, apparently, the bulls “had regained absolute control of the market.”
A perception that by seeing the flow of events, is at least questionable. At this moment the bulls are trapped, fulfilling a purely casting role, while the bears star, which many enthusiasts believe is the next sequel to the bearish horror film that started the market this year and that until the moment does not seem to be over.
According to CoinMarketCap, the general capitalization since the last analysis has been about 285,000 million dollars. At this moment it is around 255,000 million dollars. This decrease represents a fall greater than 10%, which means that the market in general lost one tenth of its value in dollars in only 7 days, this represents a significant drop and an interesting detail to take into account.
Knowing the general situation, let us summarize through the technical analysis of the 10 most capitalized currencies of the market, according to CoinMarketCap.
Technical analysis – Bitcoin BTC / USD
These last days in Bitcoin (BTC) were serious battles between the bears and bulls. At the beginning of the week, the bulls and bears gave the impression of having a similar idea of what could happen, the bears would try to make a new minimum and the bulls would easily frustrate that attempt making the price go beyond, the last relative maximum of the $ 8,500.
But at a certain point the bears tried to make the price go down very strongly and they partially achieved it, since they were able to create a descent to the $ 7,900 region, this area seemed like it was going to be the new trench taken by the bears, but the bulls showed that they still had great strength left, so they managed to reject the bears attempt to enter that area, causing the price to rise impressively close to 70% of what had come down due to the influence of the bears, that made the price close around $ 8,200.
Up until this point everything indicated that the bears had been defeated and that now the bulls would continue to control the market, but the next day the bears came reinforced and tried harder to make a new relative minimum, this time they succeeded, making the price fall to $ 7,700, a trench that the previous day seemed an unattainable dream.
The bulls apparently did not expect that second attempt on the part of the bears, so they were overconfident and lost the important area of $ 7,800, at that time it was their chance to recover that trench again, but the bears did not think the same.
After having taken the above-mentioned trenches, the bears continued to press the bulls, doing everything they could to get the bulls to pullback, for a few days they continued to advance, but this time taking it slow and gradually, as they seemed to be a little exhausted after such an attack.
As the bears moved with less force, the bulls began to gain once again greater power in the market, making that when the bears approached certain regions that they dominated, the bears had to retreat, this happened in the area of 7,400 $ for a couple of days, until again the bears managed to take that strip to keep it in their possession until now. Then they did the same when they conquered the region of $ 7,300.
At the beginning, the first entry in that area was a recognition of the area, in which they allowed the bulls to reject them making them go back again, although not in the way they had done at the beginning.
After seeing that clearly they had the advantage to conquer that area, they did it, in what was the last blow of the bears, which reached up to $ 6,900, a place where the bulls made them go back a little, only as a procedure, since it really was not an effective defense in that area.
This is how the bears managed to get the price to fall between $ 900 and $ 1,000 in less than a week, what seemed to be an unlikely scenario, since a continuation of the short-term uptrend that had begun the previous weeks was expected.
At this time it is possible that the bulls will take control again, since the bears can be extremely exhausted after the great fall they caused.
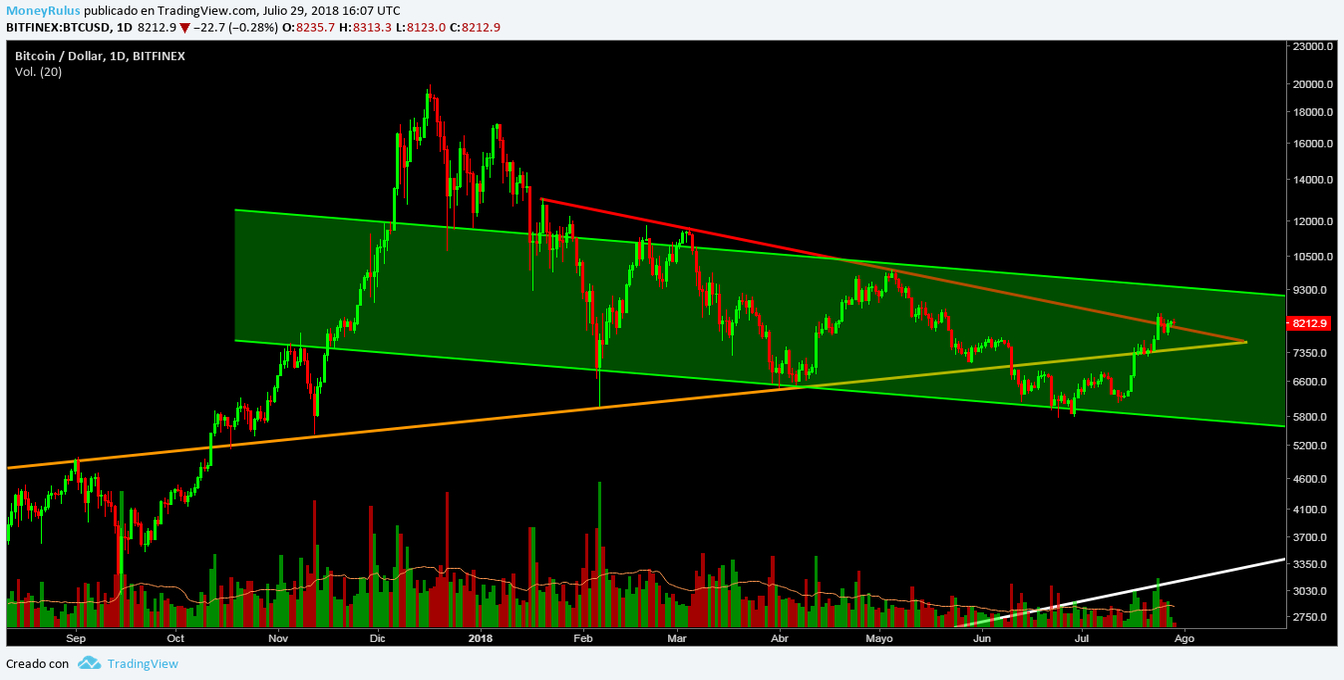
The BTC / USD pair in the BitFinex exchange house shows that the support represented by the medium-term bullish – orange – trend line was broken and became a resistance.
On the other hand, the medium-term bearish – red – trend line, which is apparently being used as a support at this time, it is possible that the price finds a temporary floor in that area, so that the bears can rest a little.
After the fall in prices, the long-term bullish – white – trend line is closer, which indicates that its importance as a possible support can grow as the price approaches it. The longer the market takes to reach the white trend line, at a higher point this could provide sustenance to the price, which may please the bulls, who know that it is a potential trench with which they could on.
The medium-term descending channel – green – is still valid, the price is within it, after having apparently changed its decision. A week ago it indicated that it was likely to go to the upper part of the channel, but now it may seem that the opposite is happening, since it is closer to the lower part of it.
This area is also a potential support in which the bulls could recharge their batteries, since it is a trend line that has served as temporary ground on other occasions in the past. Even so, if the red trend line supports the price, it is possible that it is redirected to the upper part of the green channel, but everything depends on where and when the price finds support.
The volume was strong this week, especially downward, for obvious reasons. The presence of force is a good sign of health in the market, so we can see that the currency’s vitality is in good condition.
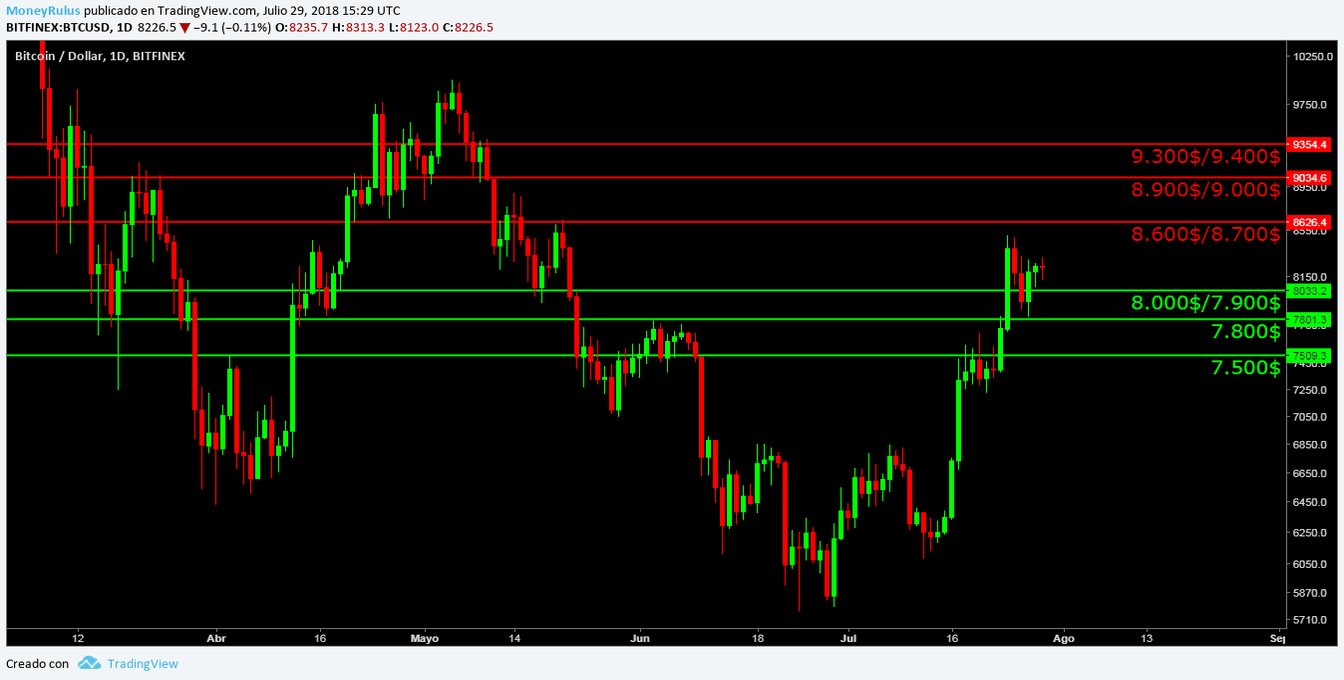
- The bears took control of old supports and made them resistances, which are now in the $ 7,200, $ 7,500 and $ 7,800.
- The bulls only retreated before the invasive advance of the bears, creating new supports in the areas of $ 6,800 / $ 6,900, $ 6,600 / $ 6,700 and $ 6,300 / $ 6,400.
Technical analysis – Ethereum ETH / USD
Unlike the previous weeks, this time ETH made movements similar to those made by BTC, it is interesting that when the BTC goes up, ETH does not necessarily do the same, but when BTC goes down, ETH is more inclined to follow the same direction. This indicates that in the second most capitalized market currency bears have more strength than bulls.
During these days, the bulls did not have absolute control at any time, being the bears who took control of the market most of the time.
In the last days of last month, the indecision was the only queen, but later the bears attacked with an overwhelming force that made the bulls lose the little influence they had during the days of laterality.
This bearish influence, brought new relative lows that made the market have in mind the idea that the bulls do not seem, for now, to have achieved the final reverse. Although during the last days the bulls, have managed to deal more effectively with the bears, getting the laterality set up again as previously seen.
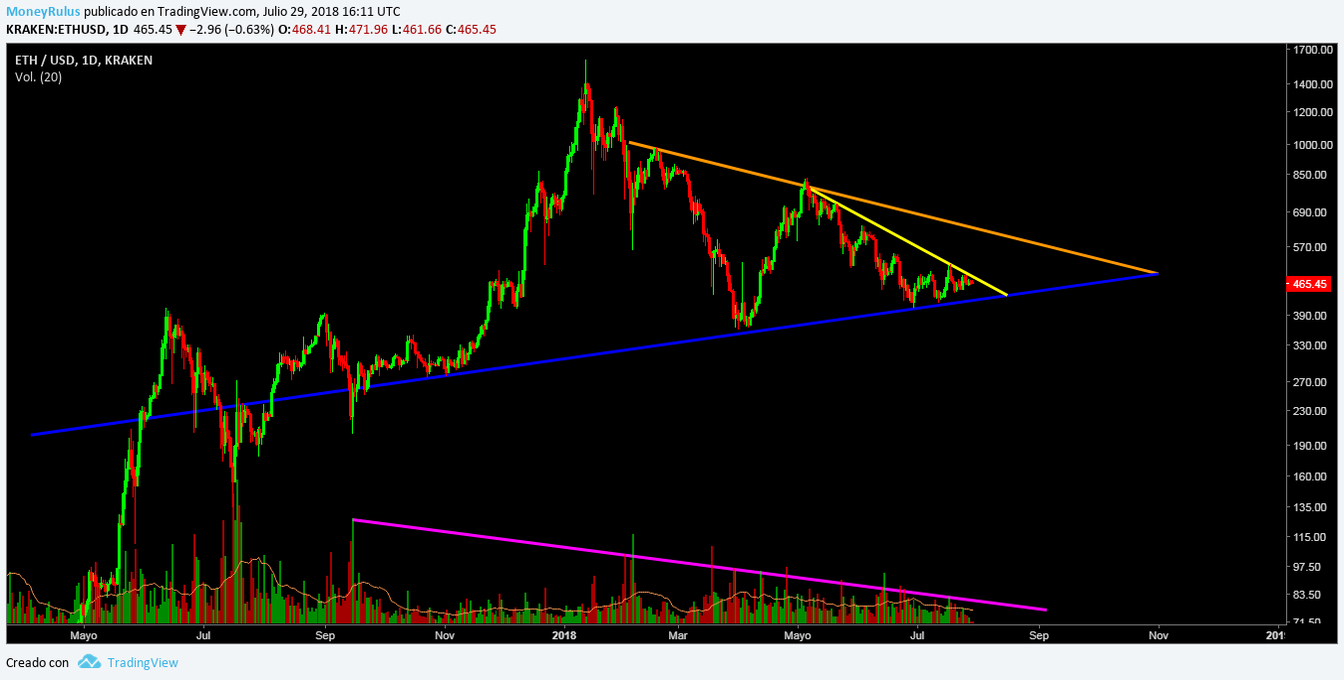
In the ETH / USD pair at the Kraken exchange, we observed that the price is slightly low in the long-term uptrend line – blue -, which served as a support on numerous occasions, at this time it is possible that the price has broken that trend line, although the possibility remains that it will return to stand on it, to cling to his old support. If not, the trend line could become a strong resistance, since before it was an important support.
On the other hand, the bearish-orange line of medium term, is very far from the price, so now it seems of little interest, but it is still important to take it into account since volatility is a characteristic part of this new financial market.
For a couple of months, the price is within a medium-term – green – descending channel, which is in full development at this time. The price has just found resistance in the upper part of that same green channel, so it is possible that it will tend to go to the lower part of it. If this happens, the blue trend line would establish itself as a resistance and the market could study the possibility of retesting the area in which the absolute minimum is found.
The volume presented interesting increases at some precise moments, to then fall again. The interesting thing is that several times it managed to touch the moving average volume in the last 20 days, which is a signal that indicates some underlying force.
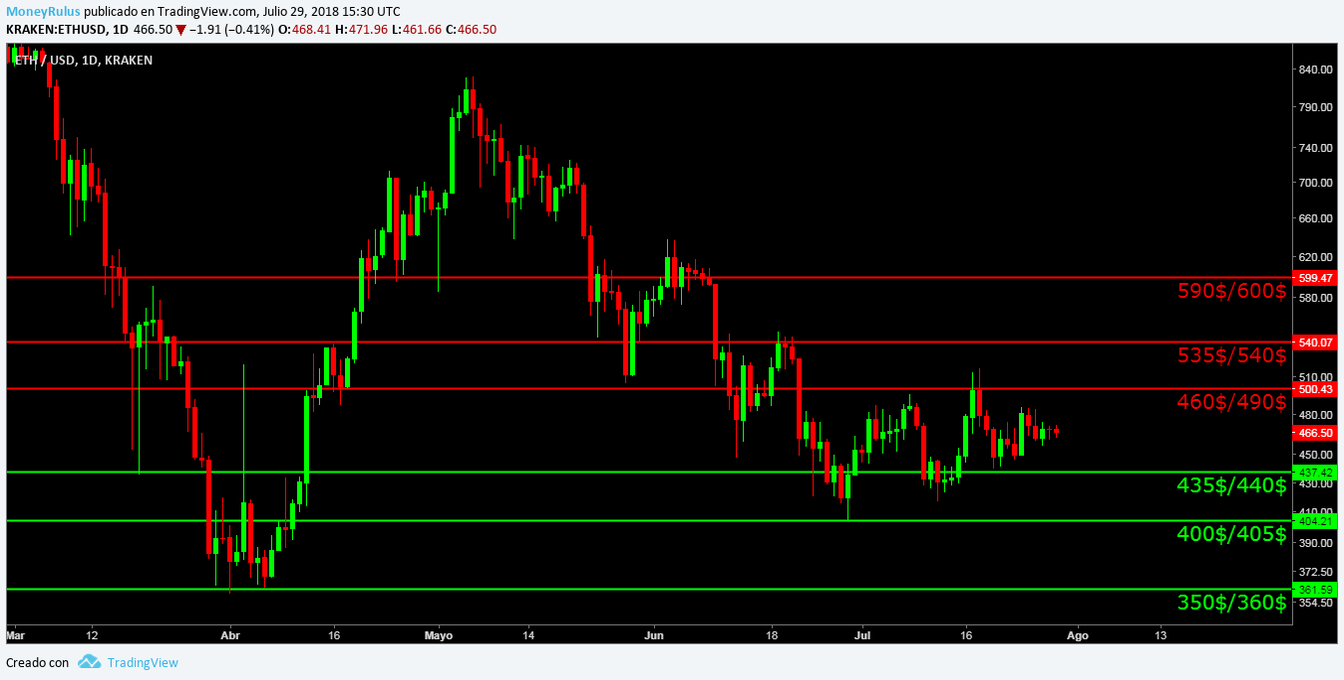
- The bears created resistances at $ 435 / $ 440, $ 460 / $ 490 and $ 535 / $ 540.
- On the other hand, the bulls formed defensive supports in the areas of $ 400 / $ 405, $ 350 / $ 360 and $ 330 / $ 340.
Technical analysis – Ripple XRP / USD
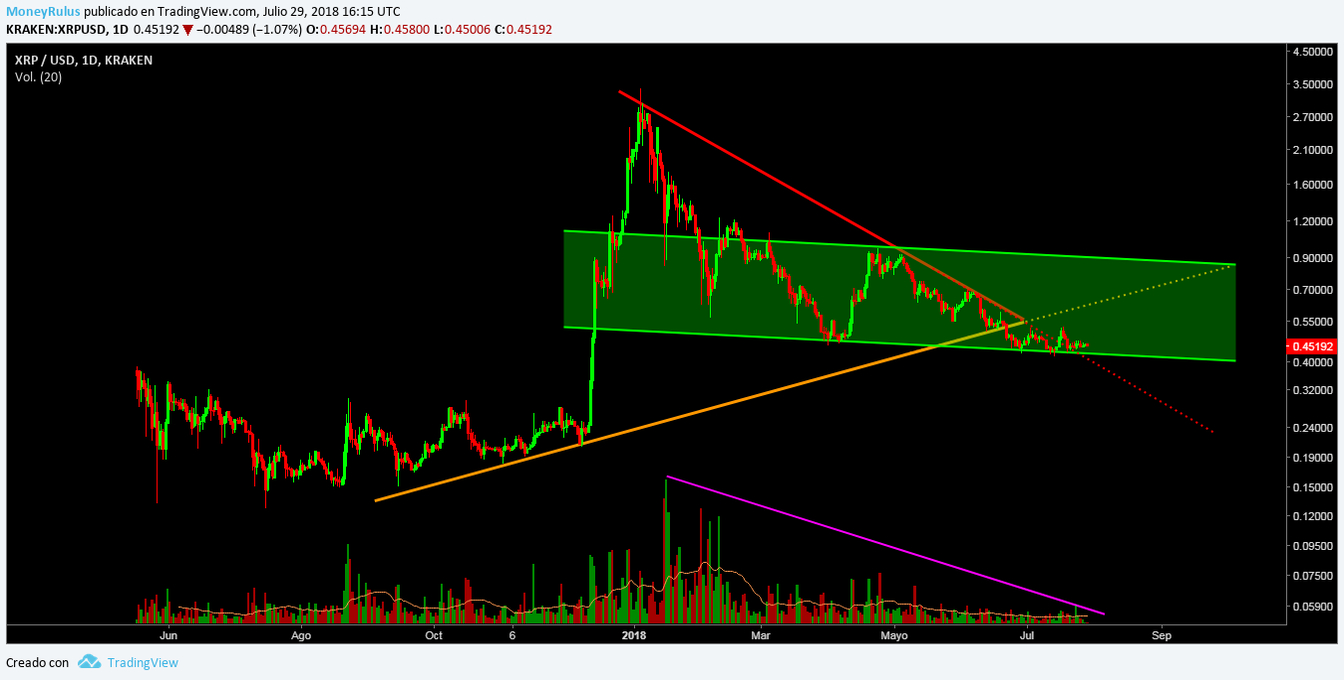
The XRP / USD pair in the Kraken exchange allows us to prove that the price is within a descending channel – yellow – short term, which has been an important support and also has served multiple times as a ceiling for the price. In turn, a large part of the yellow channel is within the medium-term – green – descending channel, which has already been taken into account for some time.
Both channels are important, but since both have different accelerations, meaning different degrees of inclination, one will have to be invalidated so that the other remains valid.
If the price decides to stay within the yellow channel, it must continue to go down until it completely leaves the green channel, breaking the lower part of it, which at this moment is an important support; afterwards then try to go to the lower part of the yellow channel, section that could also become an important support.
Otherwise, the price should stay within the green channel, respecting the lower part of it, to break the upper part of the yellow channel, which acts as a resistance.
The resistance represented by the upward trend line – orange – of long term, remains valid. If the price remains within the green channel, and after bouncing in the lower part of it, tries to go to the top, it is possible that the orange trend line regains some stellarity, as it would be an important resistance to beat so that the price will achieve the goal of reaching the top of the green channel.
The volume remained low during this week, which indicates that the price tended to fall by gravity, but also at certain times it managed to go up a bit, which shows a certain impulsiveness, which could be asleep in XRP. Impulsivity, if it exists, could at some point awaken.
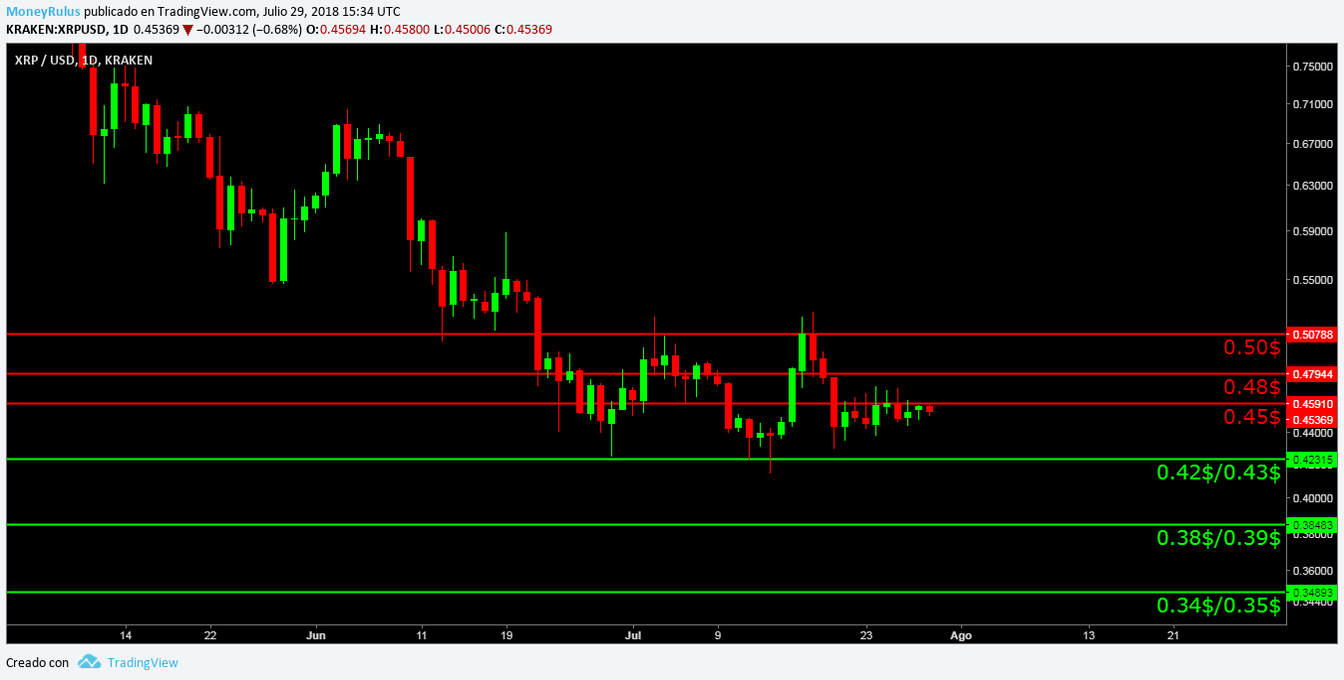
- The bears conquered several supports, now those areas act as resistance in 0.45 $, 0.48 $ and 0.50 $.
- The bulls created supports at 0.42 $ / 0.43 $, 0.38 $ / 0.39 $ and 0.34 $ / 0.35 $.
Technical analysis – Bitcoin Cash BCH / USD
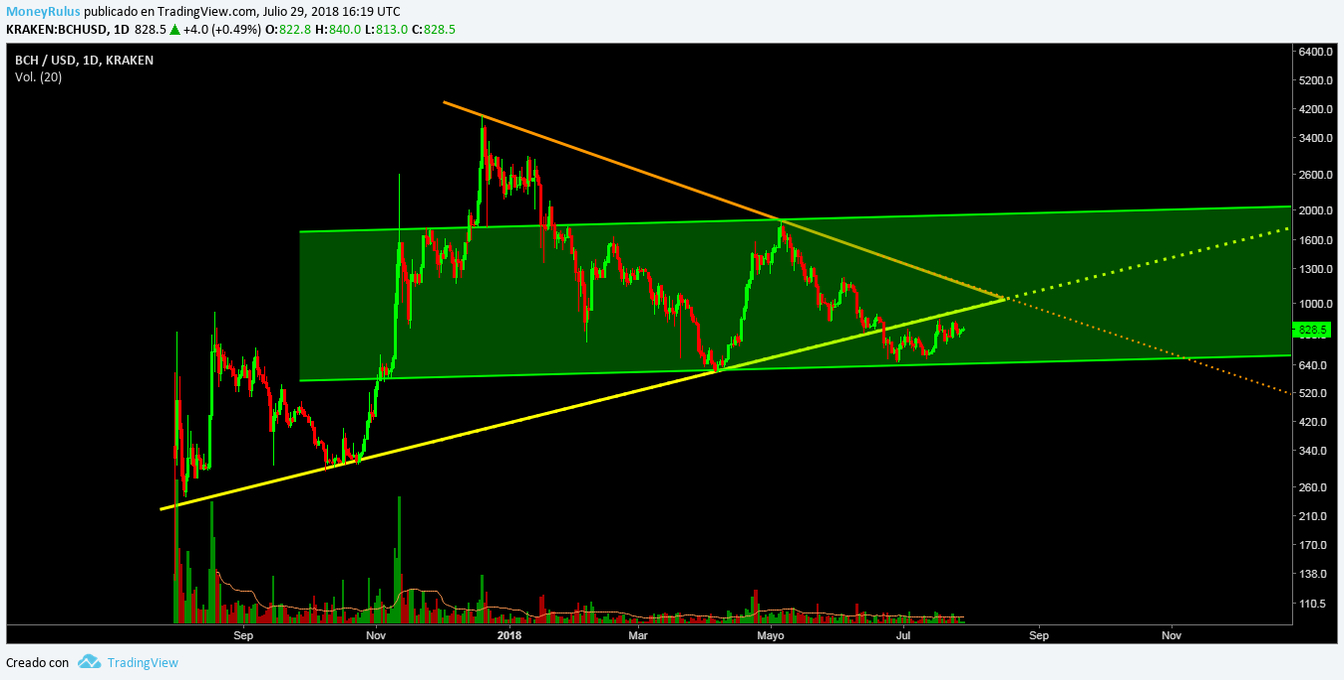
Looking at the BCH / USD pair at the Kraken exchange, we see that the price seems to be bouncing off the bottom of the long-term upward – green – channel, which has long been a high-value channel.
Now it is just below the long-term rising trend line – yellow – it remains an important resistance to be taken into account, especially if the price bounces in the lower part of the green channel and tries to go to the upper part, in that case, the yellow trend line would be a strong resistance that necessarily would have to beat to achieve its objective.
The short-term downtrend line – orange – remains valid and is playing the role of a resistance, if the price bounces in the lower part of the green channel, it will have to break the yellow trend line, which acts as a resistance, to be able to get to the top of the green channel, but before reaching even the yellow trend line, it must break the orange trend line, which is an area that joins the last relative highs that the price has had, something of great importance.
Within the green channel, a smaller channel is forming, which is the short-term bullish channel – turquoise -, which seems to be giving the price a path to continue upwards, after the rebound it made in the lower part of the channel a few weeks ago.
If the price decides to stay in this turquoise channel, it must break the orange trend line (to try to go to the top of the channel itself), which is still a possible ceiling, depending on whether or not it breaks the orange trend line, the price may or may not remain within the turquoise channel.
The volume has remained stable lately, close to the moving average of the last 20 days, which indicates that evident tranquility and opens the possibility to the fact that prices for some time have been falling by mere gravity, a plausible idea.
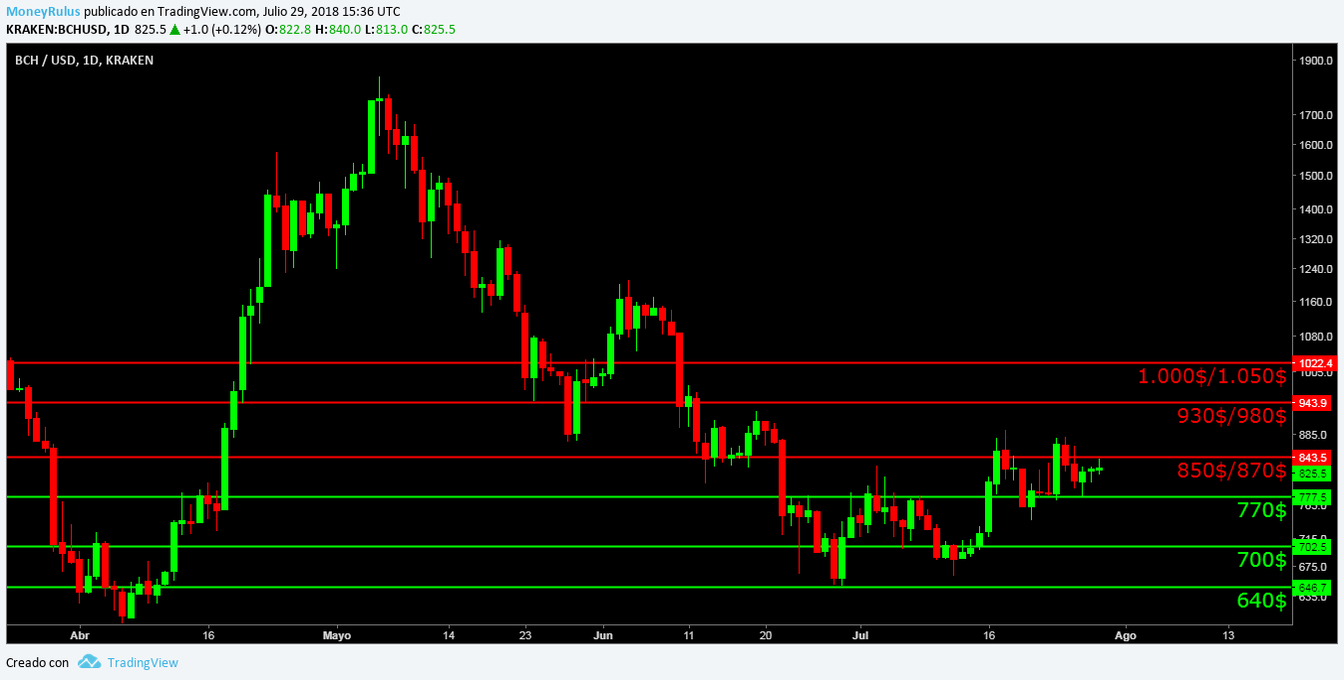
- On the part of the bears, there are resistances in the $ 770, $ 850 / $ 870 and $ 930 / $ 980.
- The bulls could create supports in the areas of $ 700, $ 640 and $ 590 / $ 600.
Technical analysis – EOS EOS / USD
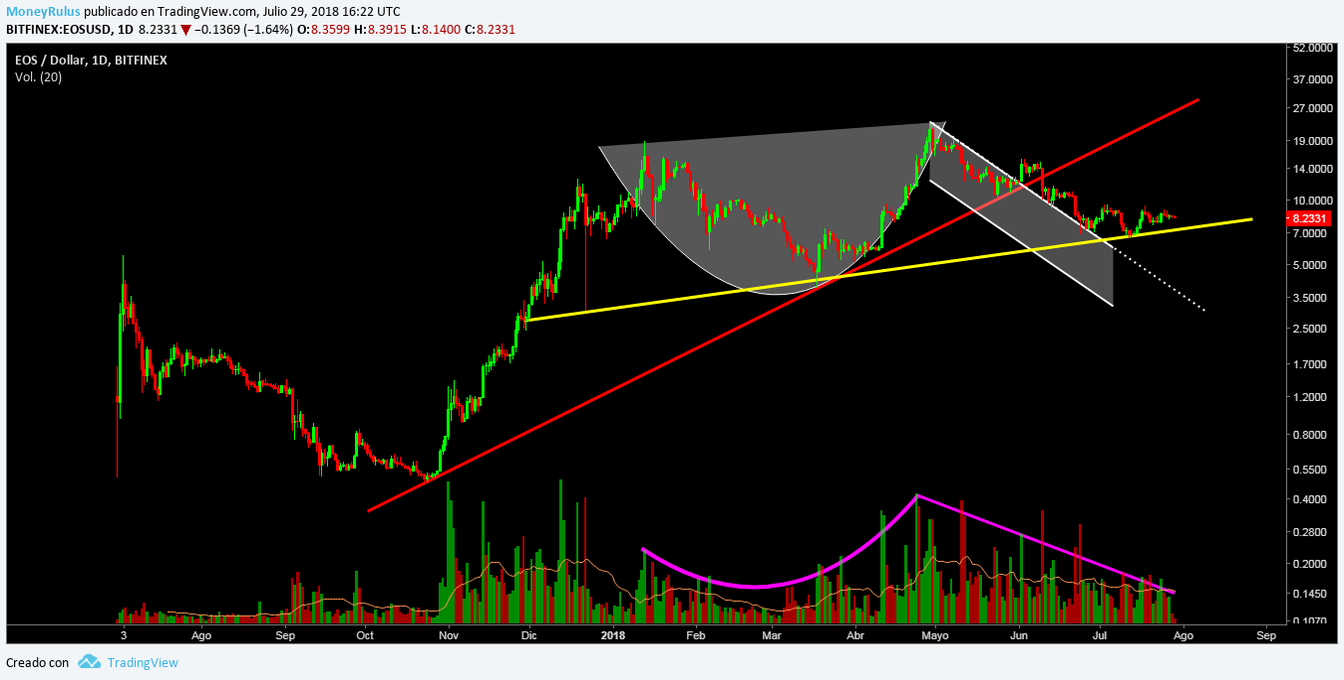
The EOS / USD pair in the BitFinex exchange clearly shows the Cup & Handle pattern that has been following for weeks, the same remains valid and attractive, since it is a pattern of change of tendency that turns out to be very strong the majority of the times.
The price has not dropped below the minimum of the Cup, so that until now (being flexible) the pattern remains valid. The price has just broken the long-term bullish – yellow – line, which had been a head support for a long time, at this moment the price seems to be below this trend line, which is a resistance since there was an exchange of roles.
In case that the price decides to return on the yellow trend line, it is possible that all this attempt to break it was just a trap for the bears, which the bulls would have created to fool their eternal rivals.
At this moment, the price is within a short-term downstream channel, which offers the possibility of continuing to decrease slowly, as time passes; if the price decides to remain in this purple channel, it must decide what it will do regarding the yellow trend line.
It seems that the price is heading towards the lower part of the purple channel, after having touched the upper part of the channel a couple of weeks ago, if this is the case, the yellow trend line could be established as a resistance, and if on the contrary the price tries to reach the upper part of the channel, the yellow trend line, could become a support again.
The volume remains one of the highest in general, so the force remains present, although decreasing gradually as indicated by the theory, which should act during the formation of the Handle.
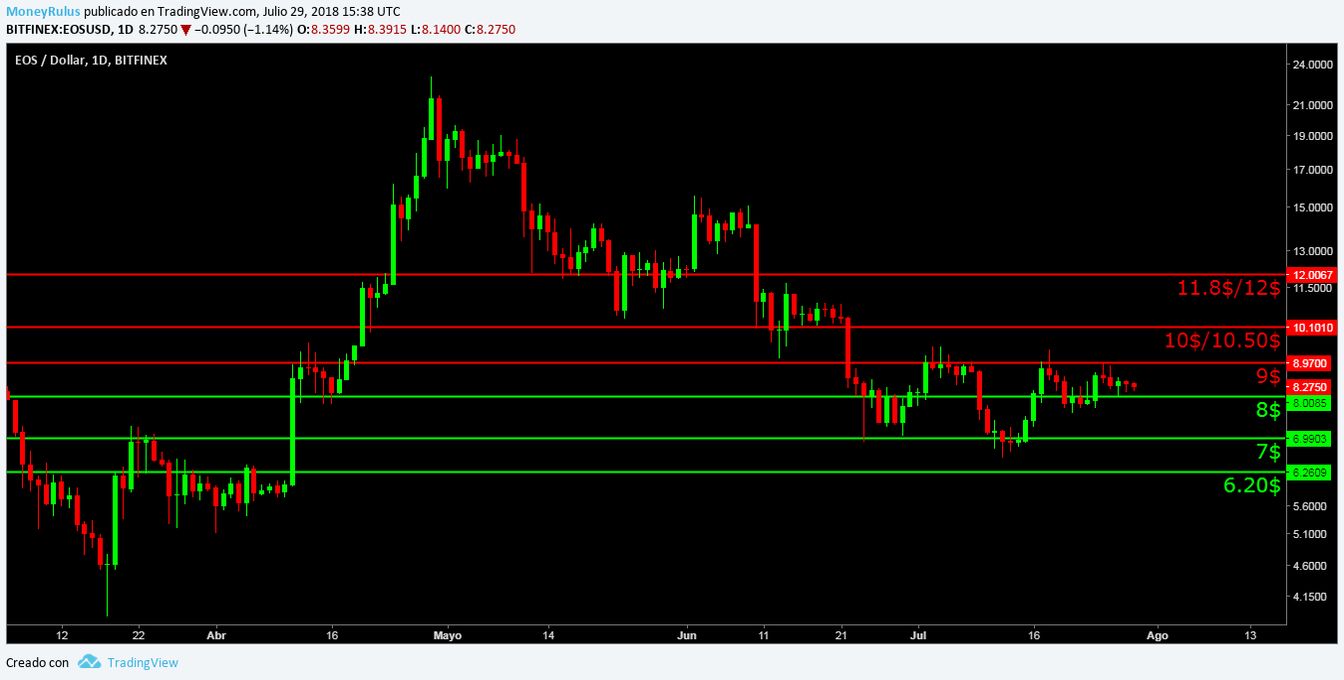
- The bears could create resistances in the $ 8, $ 9 and $ 10.
- And the bulls would consequently create supports in the areas of $ 7, $ 6.20 and $ 5.40 / $ 5.50.
Technical analysis – Litecoin LTC / USD
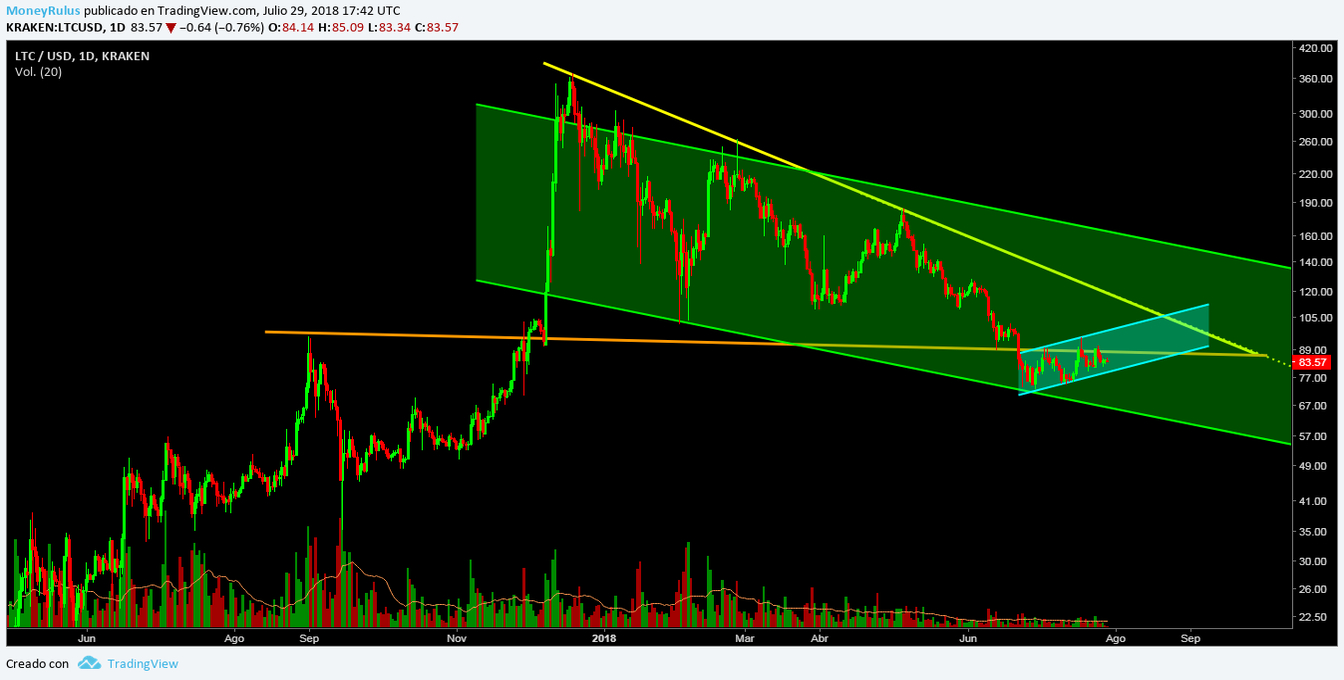
The LTC / USD pair at the Kraken exchange shows that the price broke down the short-term ascending channel – turquoise –, which offered a possible way to maintain an upward route, something that could have been valuable for the bulls.
The fact of having broken the lower part of the turquoise channel indicates that the bears clearly took control of the market in this currency, so it is possible that the price is directed towards the bottom of the long-term – green – descending channel, which has served on numerous occasions both as a support and a resistance.
In the lower part of the green channel it is possible that the price finds a floor, since it is an area in which the bulls would have the advantage to try to stop the advance of the bears in the market. If this zone gives way, it is possible that the lower part of the channel is a valued resistance.
The line of downtrend – yellow – short-term, is a resistance as last week, being now much stronger since the price did not break, so it has been ratified as a roof area.
In the same way, the long-term bearish – orange – line serves as a resistance, since it was broken some time ago when it was a support. Knowing this, we note that the price may tend to contract between the yellow trend line and the lower part of the green channel, depending on which is respected or invalidated, the currency could take some direction or another.
If it manages to break the yellow trend line, the next resistance to beat would be the orange trend line, which is an obstacle if the price bounces in the lower part of the green channel and attempts to go towards the top.
An interesting detail is that very recently the bears achieved a new absolute minimum, which indicates some strength, it is possible that they will try to make another, so without doubt the future will be a time of strong battles between the bears and bulls.
The volume seems very contracted, which is a possible indication that the price may be falling because of gravity in several alternative currencies, as would be the case of Litecoin.
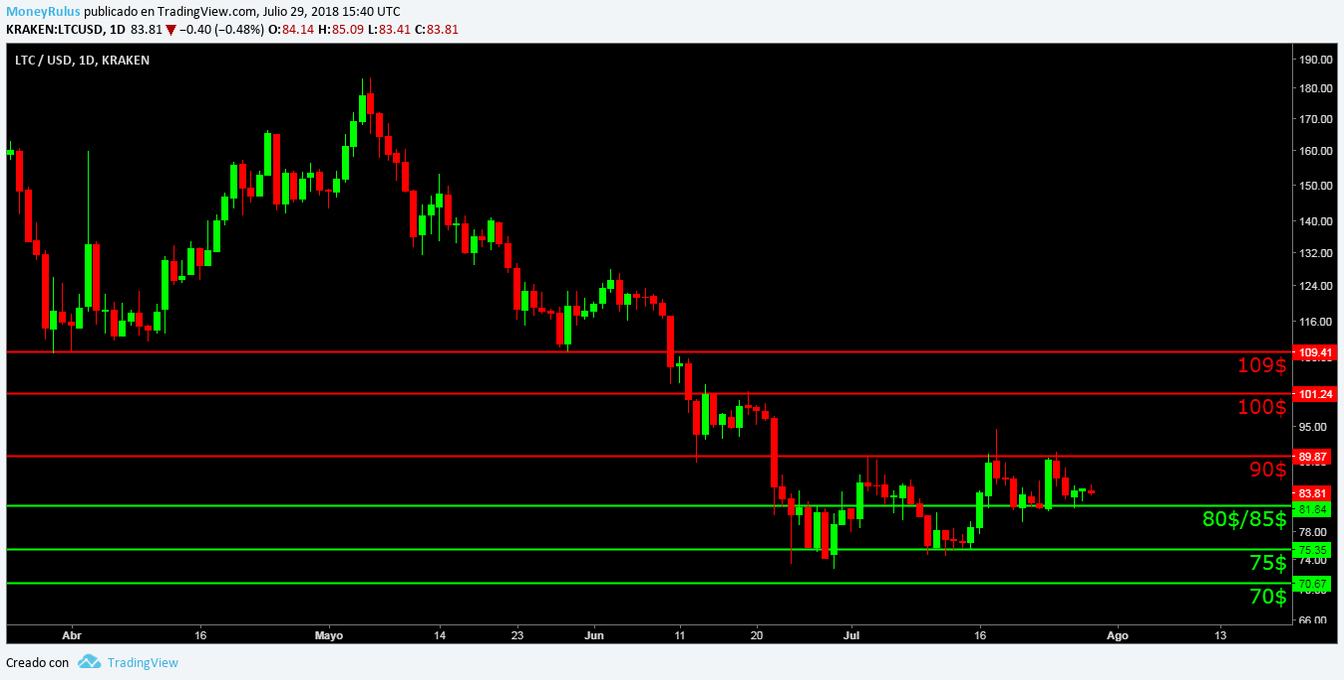
- The bears transformed the old supports into new resistances in the $ 75, $ 80 / $ 85 and $ 90 zones.
- The bulls in turn created new supports in the $ 70, $ 65 and $ 60 areas.
Technical analysis – Cardano ADA / USDT
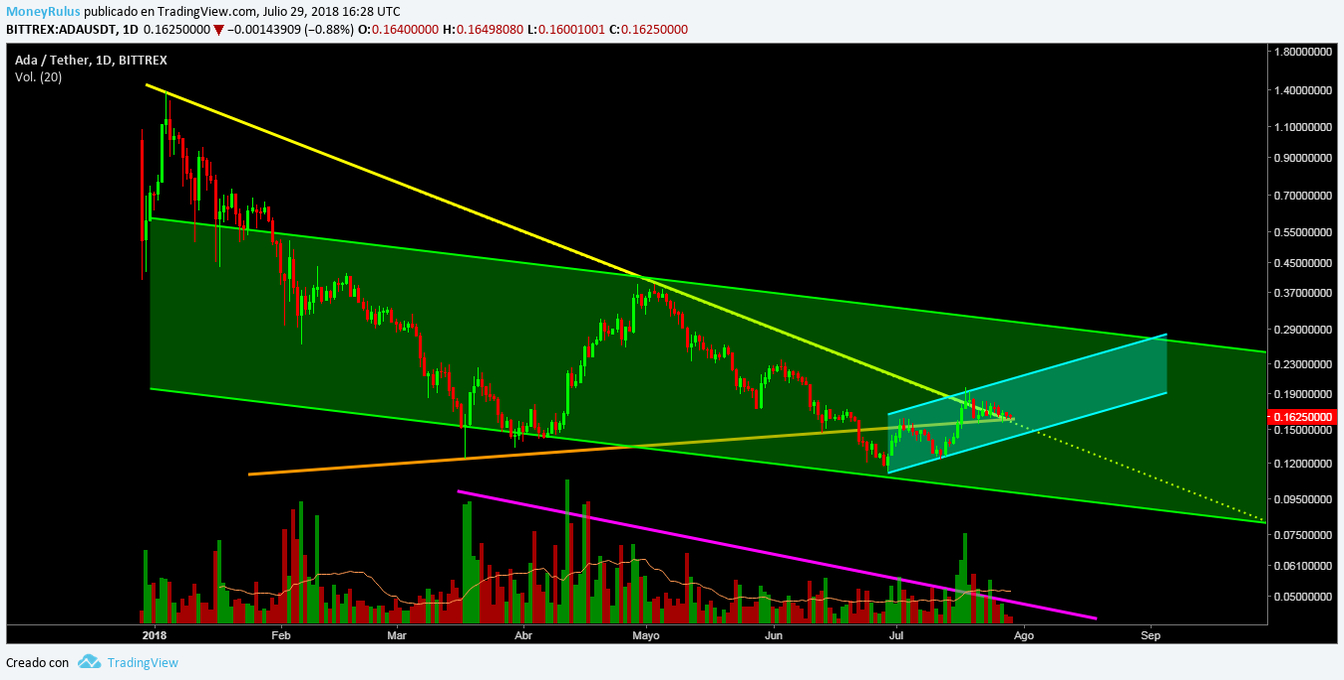
The ADA / USDT pair at the Bittrex exchange allows us to glimpse that the price remains within the long-term – green – descending channel, which has allowed the price to fall in a better way for some time.
At this time it is closer to the lower part of the channel, than to the upper part, so the probability that it is directed towards the lower part is greater than the one that there is to move towards the upper part of the green channel.
A short-term ascending channel – turquoise – is forming within the green channel, which seems to be guiding the bullish attempt being made by the bulls, to move on the coin; It is interesting that if this channel is respected, at some point the price should leave the green channel, but that does not seem very likely to happen, so although it may be useful to keep it in mind, it is not urgent for now in these conditions.
The descending trend line – yellow – short term, is playing the role of a resistance at this time, so it is possible that the price will not find support in that area.
If both the turquoise channel and the yellow trend line remain valid, the price could be contracted between the two, since one provides support and the other provides resistance. In case the turquoise channel is broken down, the price can be directed towards the lower part of the green channel, as we have already said.
On the other hand, if the yellow resistance and the upper part of the turquoise channel are broken, it is possible that the price will move towards the upper part of the long-term green channel.
The price is very close to the absolute minimum, if the bears attack with force, perhaps they could achieve a new absolute minimum, just as they did in LTC recently.
The volume is moderately strong, this is something that is common in the currency because, together with EOS, it is one of the strongest in general. This presence of force says a lot about the interest that investors keep in Cardano, a project that undoubtedly it makes many sigh.
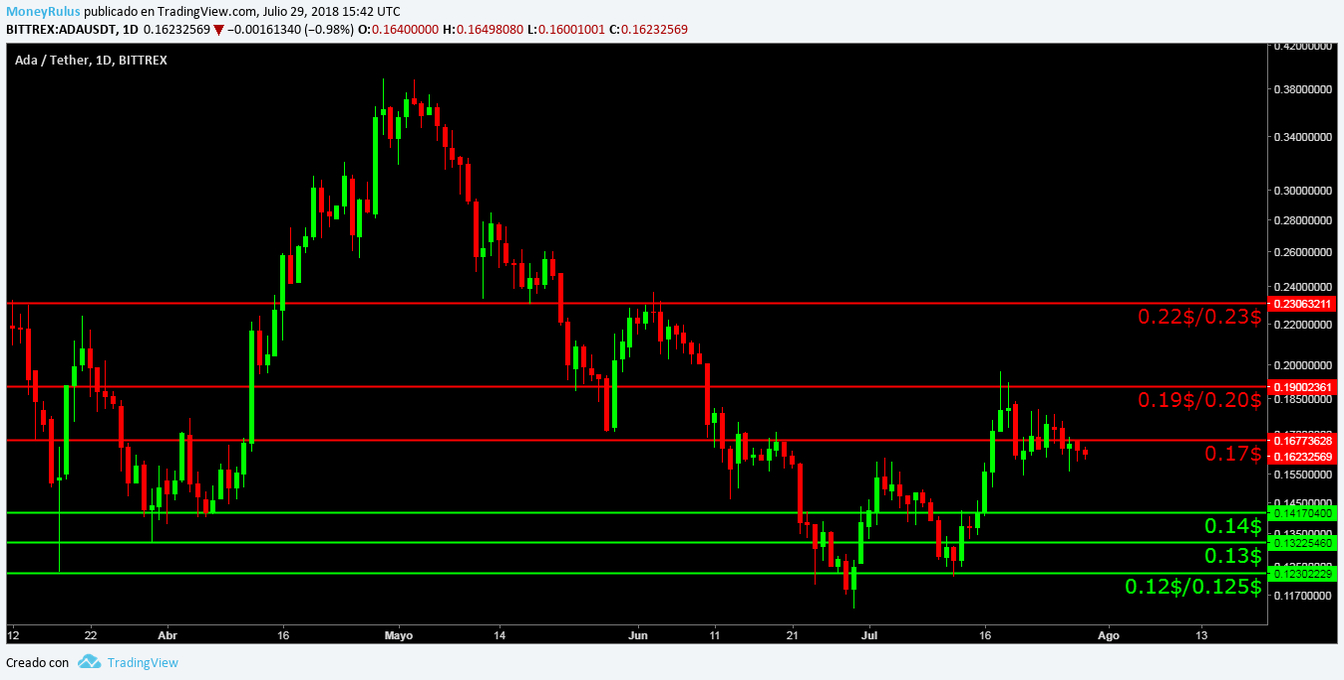
- Bears can form resistances at 0.13 $, 0.14 $ and 0.17 $.
- The bulls would have to create supports in the areas of 0.12 $ / 0.125 $, 0.11 $ and 0.10 $.
Technical analysis – Stellar Lumens XLM / USD
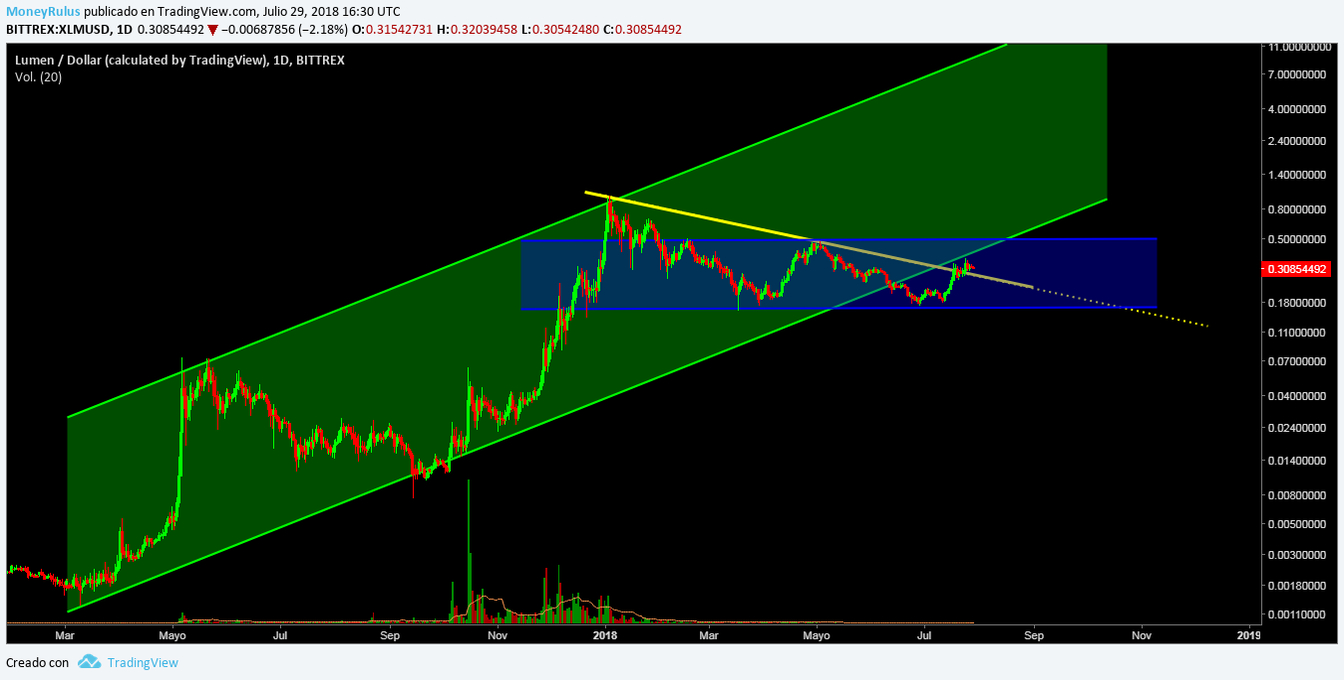
The XLM / USD pair in the Bittrex exchange exemplifies the way in which the price lateralizes, now it is inside a lateral channel – blue – long term, this channel is a perfect sample of the way in which the laterality can seize a coin, so that neither the bears nor the bulls have absolute control of it.
A few weeks ago it bounced in the lower part of the blue channel, so at this moment it seems to be heading towards the top of it. Within that blue channel, a short-term bearish – orange – channel is forming, which gives the impression of trying to maintain a short-term downtrend, which could end with laterality in the future.
In the middle of the attempt that could be making the price reach the upper part of the blue channel, it found resistance in the upper part of the orange channel, the same that stopped the impulse of the price, after having done that, it is possible that price is directed towards the lower part of the orange channel, to try to find support in that area.
The long-term trend line – yellow – remains a strong resistance, right in the area where the upper part of the orange channel coincided with this resistance is where the price found a ceiling that it could not overcome, a clear demonstration of strength by the yellow trend line.
The volume as the previous weeks is very low, so it is very possible that this currency is falling by gravity, meaning by mere loss of interest on the part of operators.
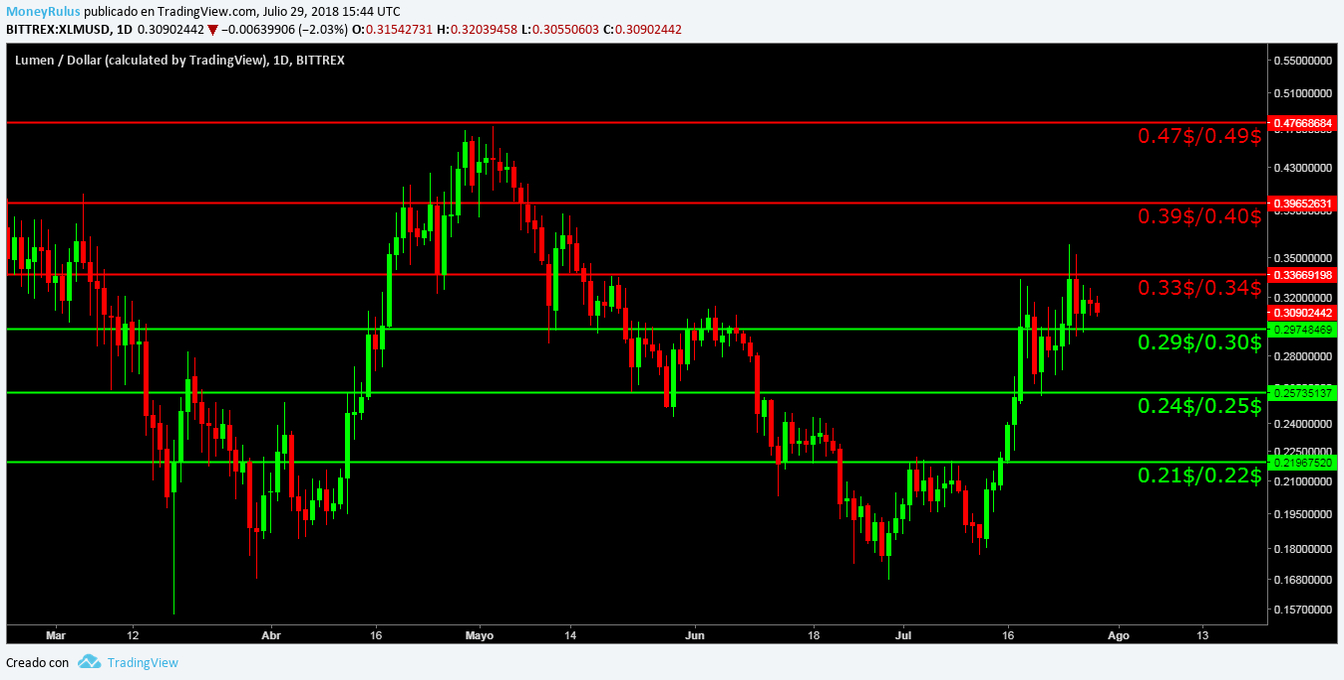
- The bears have resistances at 0.24 $ / 0.25 $, 0.29 $ / 0.30 $ and 0.33 $ / 0.34 $.
- On the other hand the bulls have supports in the bands of 0.21 $ / 0.22 $, 0.20 $ and 0.18 $.
Technical analysis – IOTA IOTA / USD
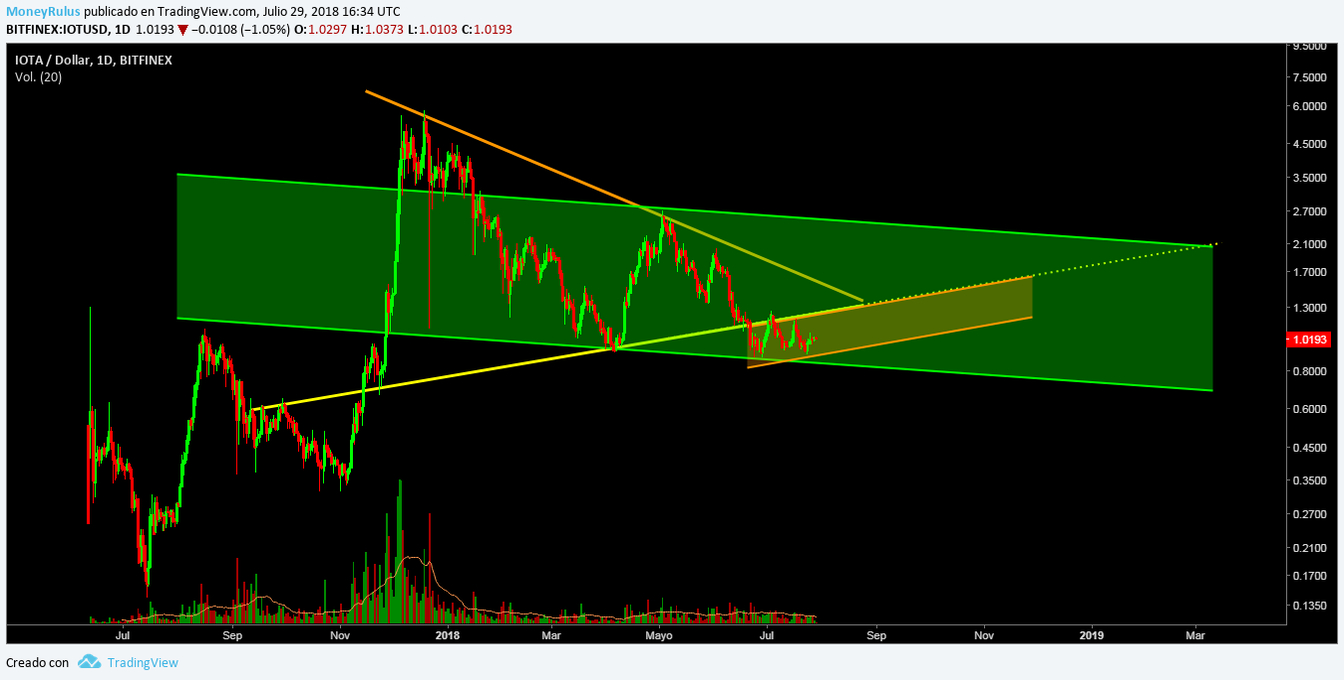
The penultimate pair is IOTA / USD in the BitFinex exchange which shows us that the price is within a long-term – green – descending channel, which we have been considering for some time.
At this moment the price has just bounced off the lower part of the channel, after the attempt to go to the top, failed. The lower part of the channel was confirmed as a valued support, so it could be again in the future.
After having bounced in the lower part of the green channel, the price can again try to go to the top of it. Within the green channel, a bearish channel – orange -is being formed in the short term, which shows a path a little faster than the green channel, a path that the price will decide whether to prefer or not, that will remain to be seen.
The last time the price tried to go towards the upper part of the green channel, the upper part of the orange channel stopped it, an area that proved to be a ceiling with the potential to stop the impulse that the price brings after a rebound; Now it is possible that the price is heading towards the upper part of the orange channel again, to once again try to beat that resistance.
The long-term bullish – yellow – line continues to be an important resistance, although the price has not visited it for some time. In this case, the bears also managed to make a new absolute minimum recently, which reinforces the idea that they have the ability to do interesting things after more than 7 months of correction.
The volume increased just as attractive as last week, indicating strong injections of force at specific times, but then tended to stabilize.
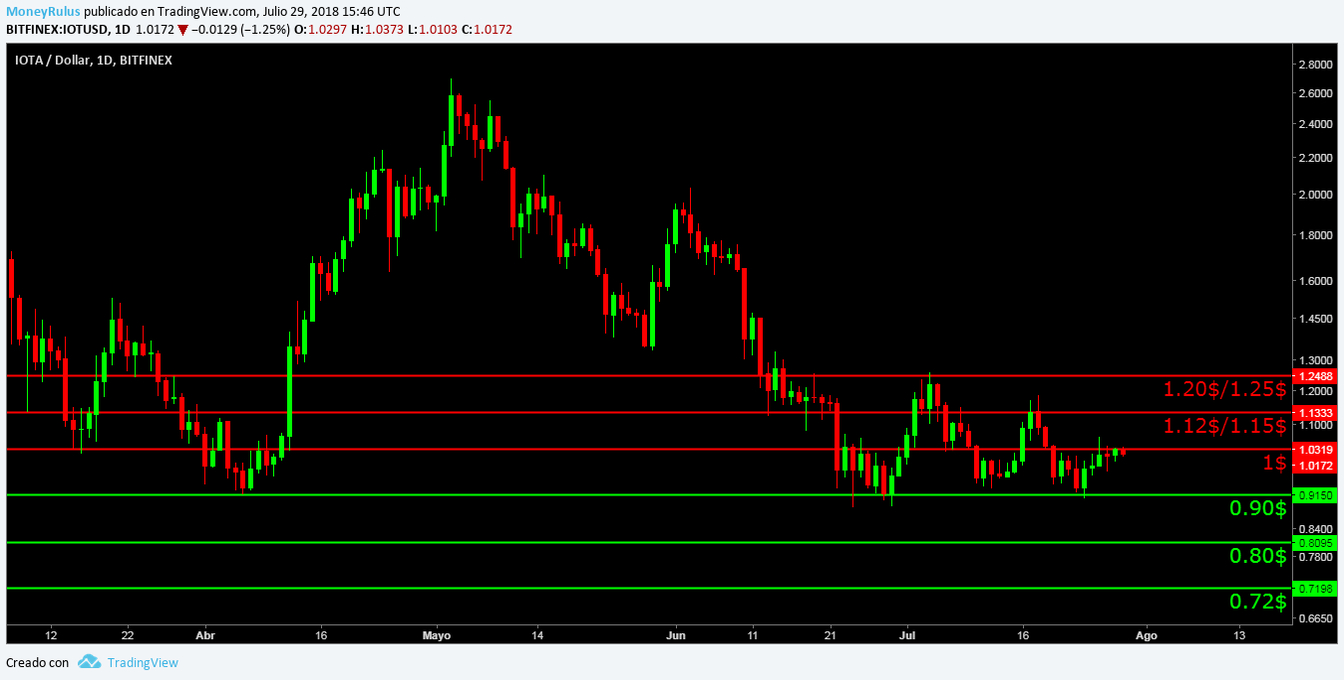
- The bears took the zones of $ 0.90, $ 1 and $ 1.12 / $ 1.15.
- The bulls created supports, reinforcing the 0.80 $, 0.72 $ and 0.65 $.
Technical analysis – Tron TRX / USD
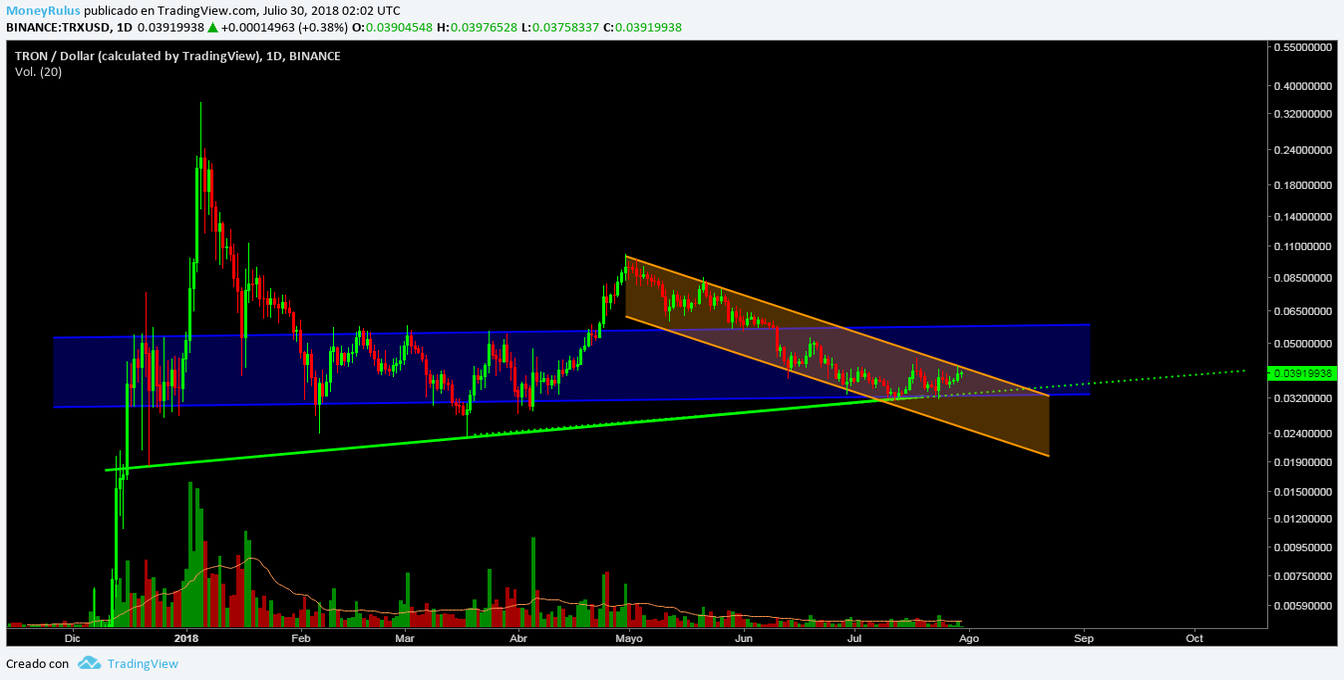
Finally, let’s analyze the TRX / USD pair in the Binance exchange, which was moved again by the currency based on the US dollar, the Tether, this is possibly because many operators and investors took refuge in this currency to obtain liquidity in average of the decline that prices generally experienced.
Anyway, let’s continue with TRX that is showing us really interesting things. At this moment the price is receding part of the advance made by the bears, in the lower part of the lateral channel – blue – in the long term, which has provided in many cases support in its lower part, right there is where the price is bouncing, so we can take into account that the area is strong, with potential to serve as ground.
Besides that, for a couple of months it has been creating a medium-term – orange – descending channel, which has been respected very well, the price at this moment is bouncing off the lower part of the blue channel, because it found a strong resistance in the upper part of the orange channel, which did not let it continue upwards, in a possible attempt to approach the upper part of the blue channel.
Recently, the long-term bullish – green – trend line was broken as a support, so it became a resistance, if the price wants to go back to the upper part of the orange channel (after bouncing back in the lower part of the blue channel), the green trend line would be a resistance to overcome, to try to continue on its way, so now it remains in its important role.
If the bears have a lot of strength they could try to make a new absolute minimum, as they have in other currencies, although due to the distance of the price is at this moment, it may be more difficult.
The volume has remained stable, so it is possible that if the currency falls, it does so by gravity, such as others of which we have spoken about.
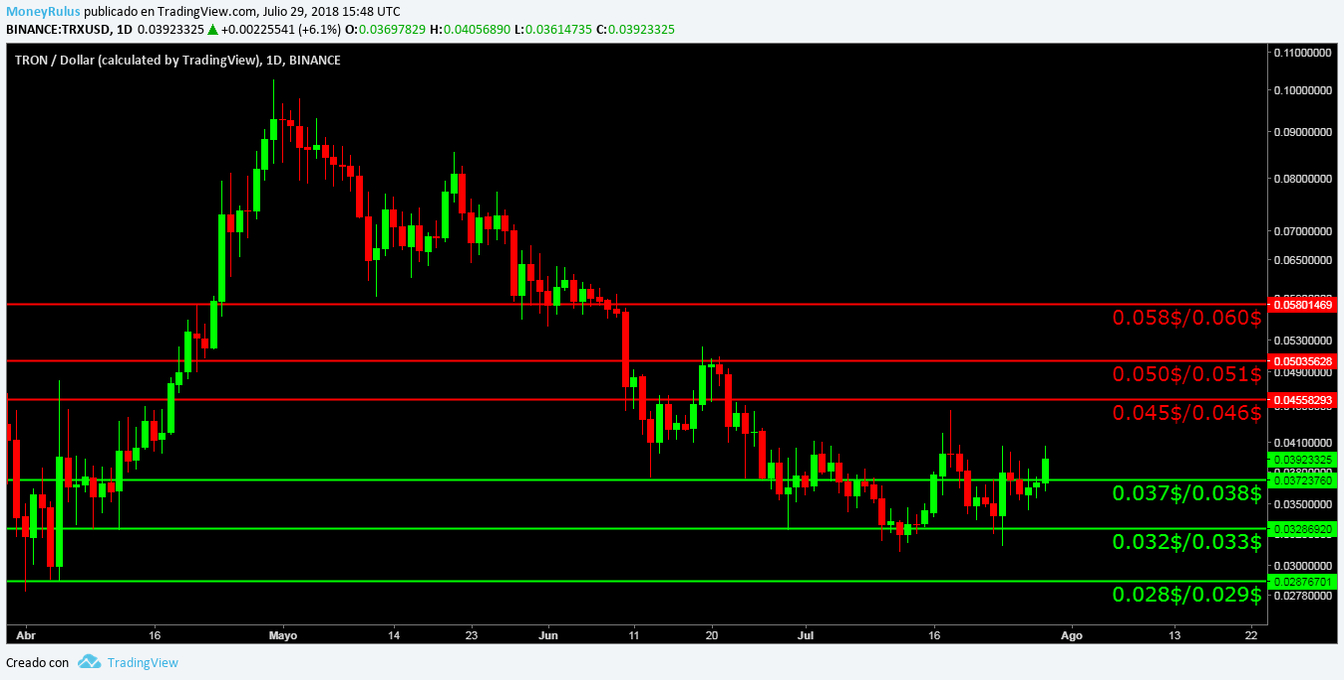
- Bears could increase the selling pressure and create resistances at 0.032 $ / 0.033 $, 0.037 $ / 0.038 $ and 0.041 $.
- And finally, the bulls would know how to create greater purchase pressure at 0.028 $ / 0.029 $, 0.024 $ and 0.021 $ / 0.020 $; to achieve establishing new supports.
“This article has been made by our Analyst: Jose Antonio, Lover of learning and teaching, in love with trading and enthusiast of the Cryptophere. You can follow him on Steemit or TradingView “