Since last week, the market in general has been experiencing a large drop, result of the control (almost absolute) taken by the bears. We bring you the Technical Analysis point of view of the of the first 10 currencies in market capitalization (Bitcoin, Ethereum, Ripple, Bitcoin Cash, Eos, Litecoin, Cardano, Stellar Lumens, Iota, Tron), according to CoinMarketCap.
The prices decreased abruptly during the previous weekend, but in this one the story is different, the bulls have had enough strength to stop bears that were exhausted, because they had used up a lot of force during the last days, breaking about 4 or 5 important supports that we had in mind.
Currently, laterality has the market in their hands, so we can say that we are in no-man’s land, a place where, without a doubt, anything can happen.
Bitcoin, BTC / USD
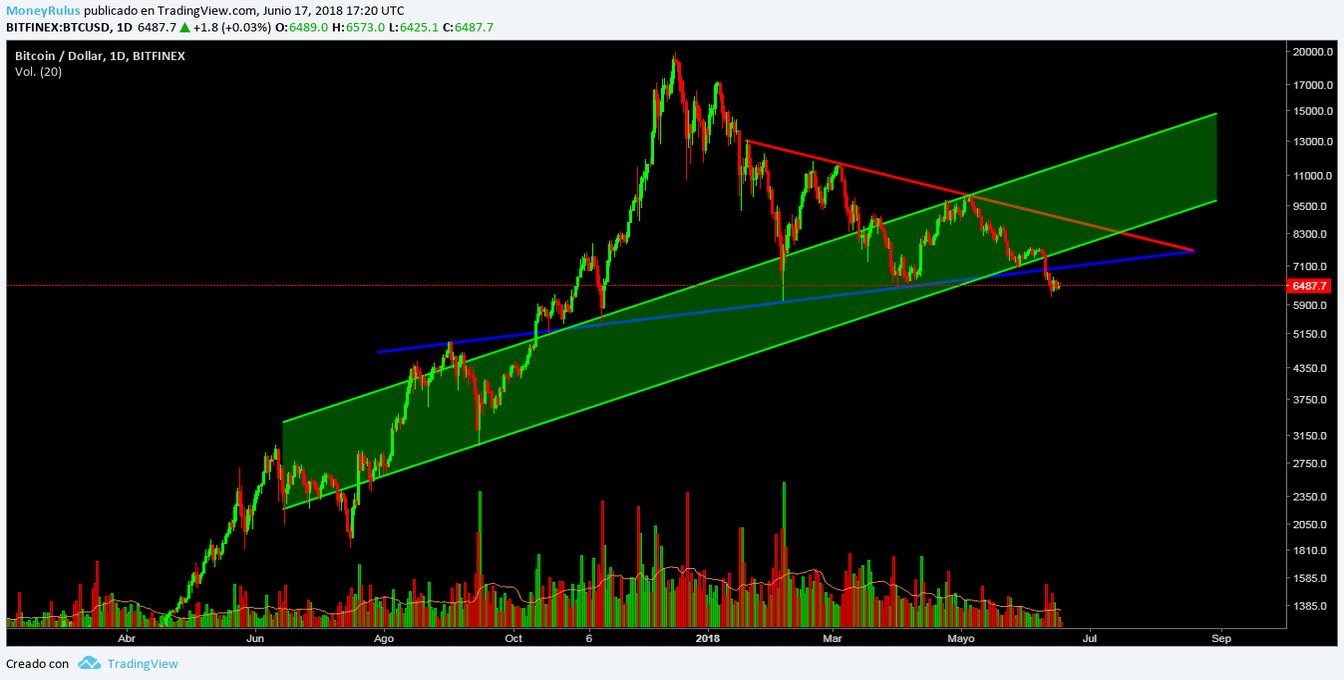
Beginning with the senior pair, BTC / USD in the BitFinex exchange house, the first thing that stands out is the fact that after the bears broke the most important support of the year, represented by the blue trend line, the bulls did not have the strength, until now, to put the price back on the current resistance, even though they undoubtedly made a valid Pull back, which did not acquire enough strength to break the ceiling, that had only recently imposed at that time.
In the case of the bulls taking over control again and making the prices rise, apart from the blue trend resistance line, they will have to break the resistance created by the lower part of the green rising channel. That, just to be able to have the opportunity to fight with the original resistance, shaped by the red trend line.
Besides that, we know that the bears during the last days managed, diligently, to make a new minimum, something that was not observed for more than 4 months and without a doubt a show of fierceness.
The volume shows some fatigue on the part of both sides, so the most prudent thing is to await a clear signal from the market, to act.
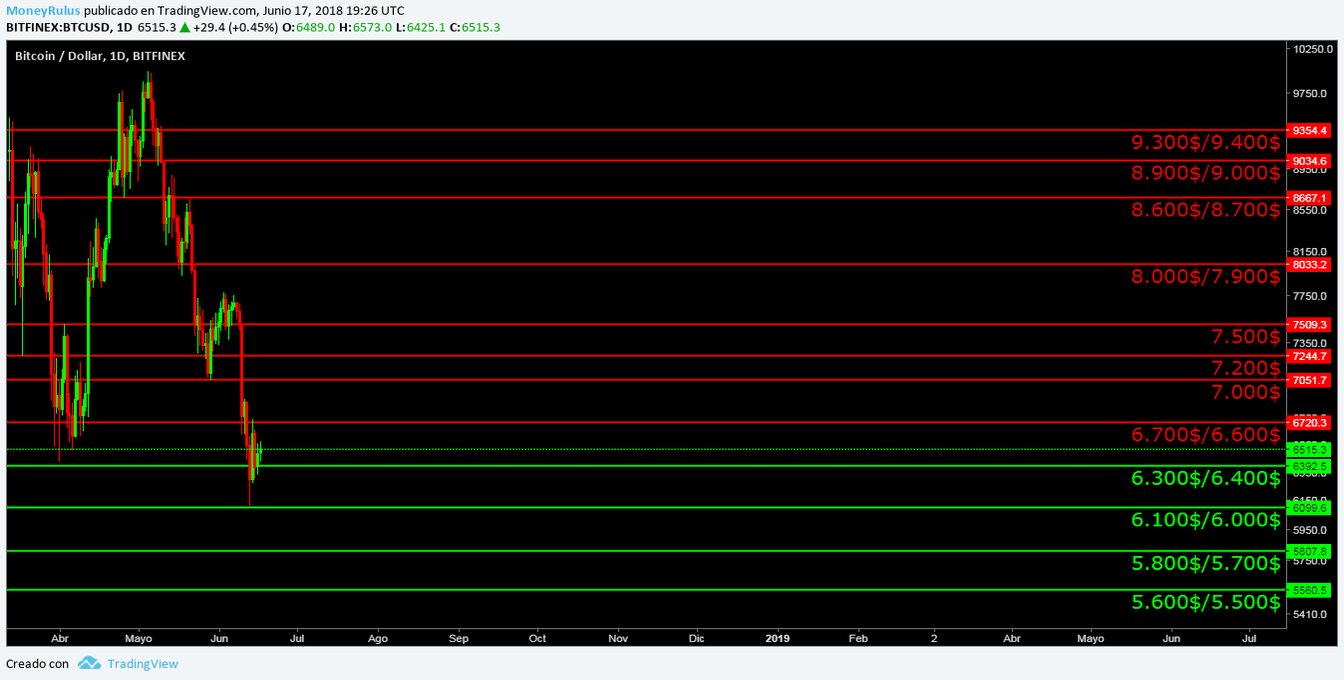
- As supports, the areas of $ 6,300 / $ 6,400, $ 6,100 / $ 6,000, $ 5,800 / $ 5,700 and $ 5,600 / $ 5,500 are presented. Areas that can serve as platforms, at the time of a strong rebound, by the bulls.
- And in the role of resistances, the number of areas increases considerably, we have the areas of $ 6,700 / $ 6,600, $ 7,000, $ 7,200, $ 7,500, $ 8,000 / $ 7,900, $ 8,600 / $ 8,700, $ 8,900 / $ 9,000 and $ 9,300 / $ 9,400. There are more possible ceilings, as we undoubtedly continue in a medium term downtrend therefore leaving sequels.
Ethereum, ETH / USD
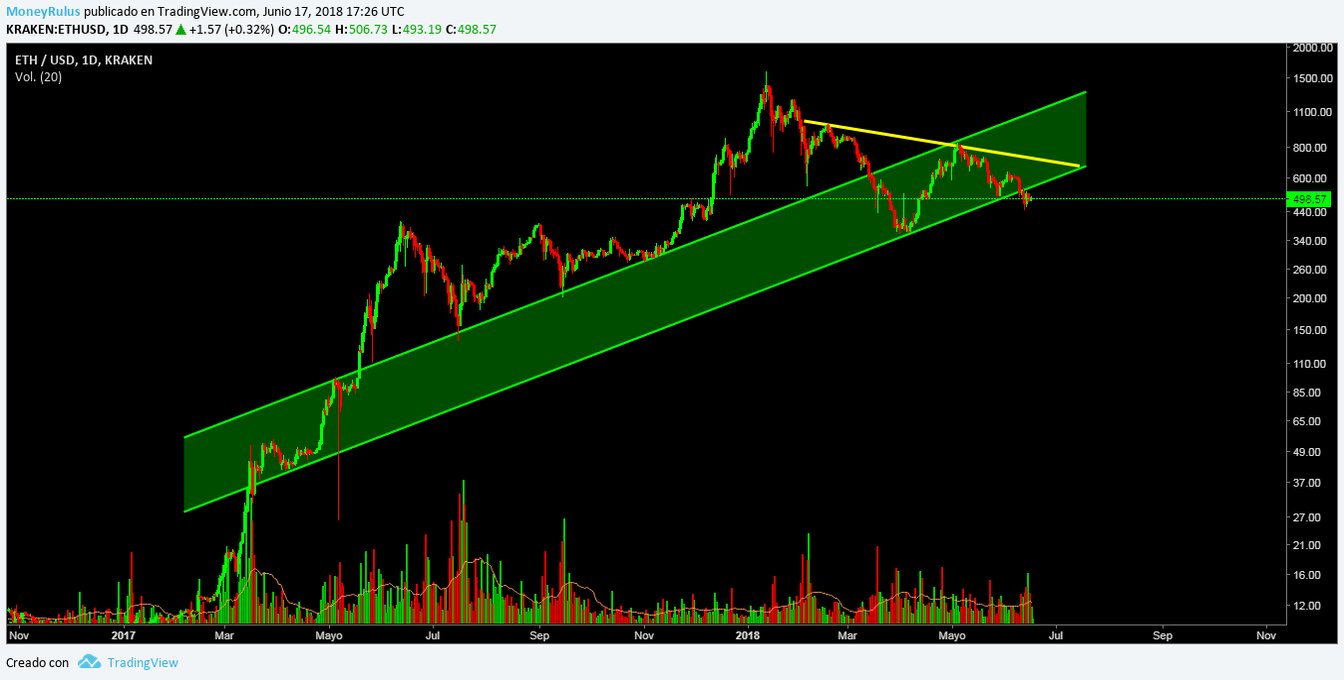
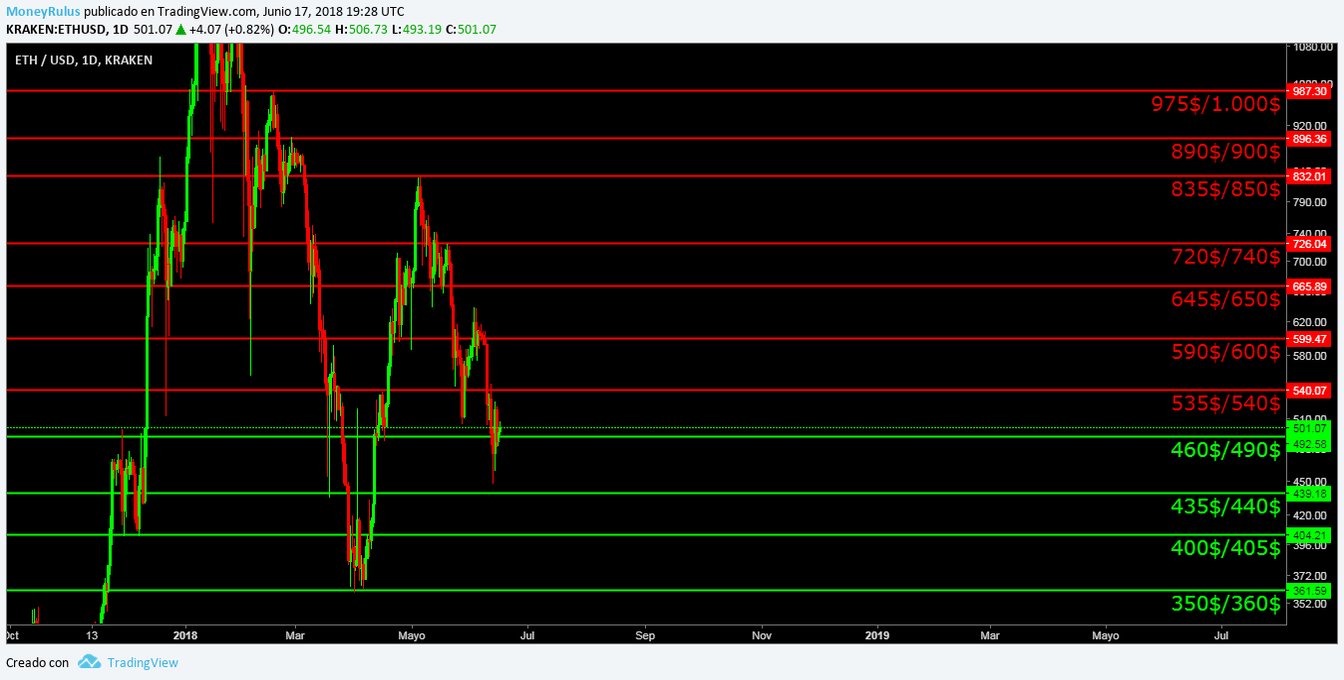
The case of ETH / USD in the Kraken exchange house is very interesting. It shows the same upward channel, of green color, that we have been studying for weeks. It also presents the same resistance personified by the yellow trend line, which has been created by the last 2 maximums of the year.
The curious thing about the pair, is that like BTC, after breaking the bottom of the ascending channel, in a strong move of the bears, the bulls have failed to recover that area, which now shines by its absence in the list of potential supports.
This fact shows that, as in the past, many alternative currencies keep certain reminiscences of the BTC movements in their quotes, something undoubtedly very suggestive.
The volume at this time does not support either side; the price is lateral, so it is best to be suspicious.
- If it is looking for supports, the currency can find them in the areas of $ 460 / $ 490, $ 435 / $ 440, $ 400 / $ 405 and $ 350 / $ 360. The range of $ 435 / $ 440 has been an important floor in recent days, so it undoubtedly becomes relevant from now on.
- The possible ceilings are in the areas of $ 535 / $ 540, $ 590 / $ 600, $ 645 / $ 650, $ 720 / $ 740, $ 835 / $ 850, $ 890 / $ 900 and $ 975 / $ 1,000. Areas that can have a lot of strength, when it comes to stopping the bulls.
Ripple, XRP / USD
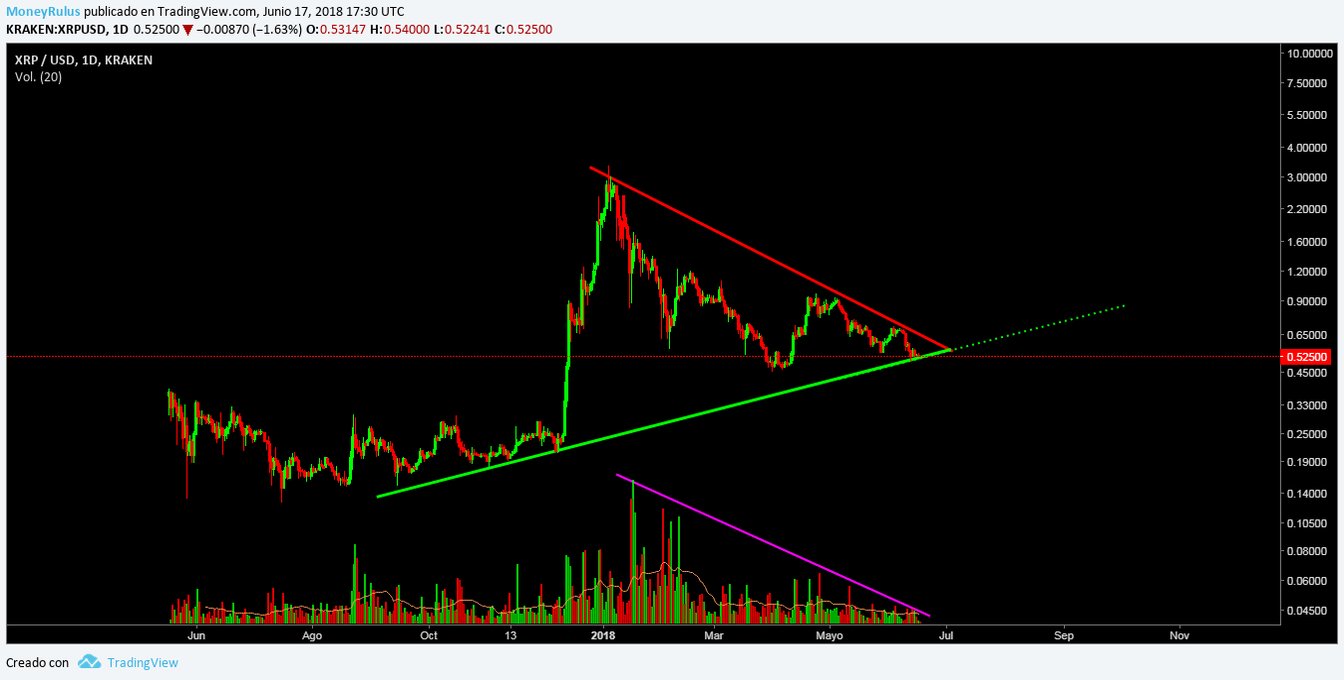
The pair XRP / USD in the Kraken exchange house looks renewed, with a new possible giant symmetrical triangle pattern. The same one was created after the price invalidated the previous one, breaking it to the loss.
This triangle can have very large projections for the medium-long term in the case if it is completed and validated in the appropriate manner. The volume has decreased during the formation of the pattern, something that exemplifies the clear support that exists.
The ideal is to be patient and wait for the decisions of the market, but, something important is that the price is on a strong long-term support, a detail that can greatly favor the bulls.
The bears show a certain tranquility after having pushed very hard downwards and are probably resting. The volume shrinks more and more, so the pressure may be increasing.
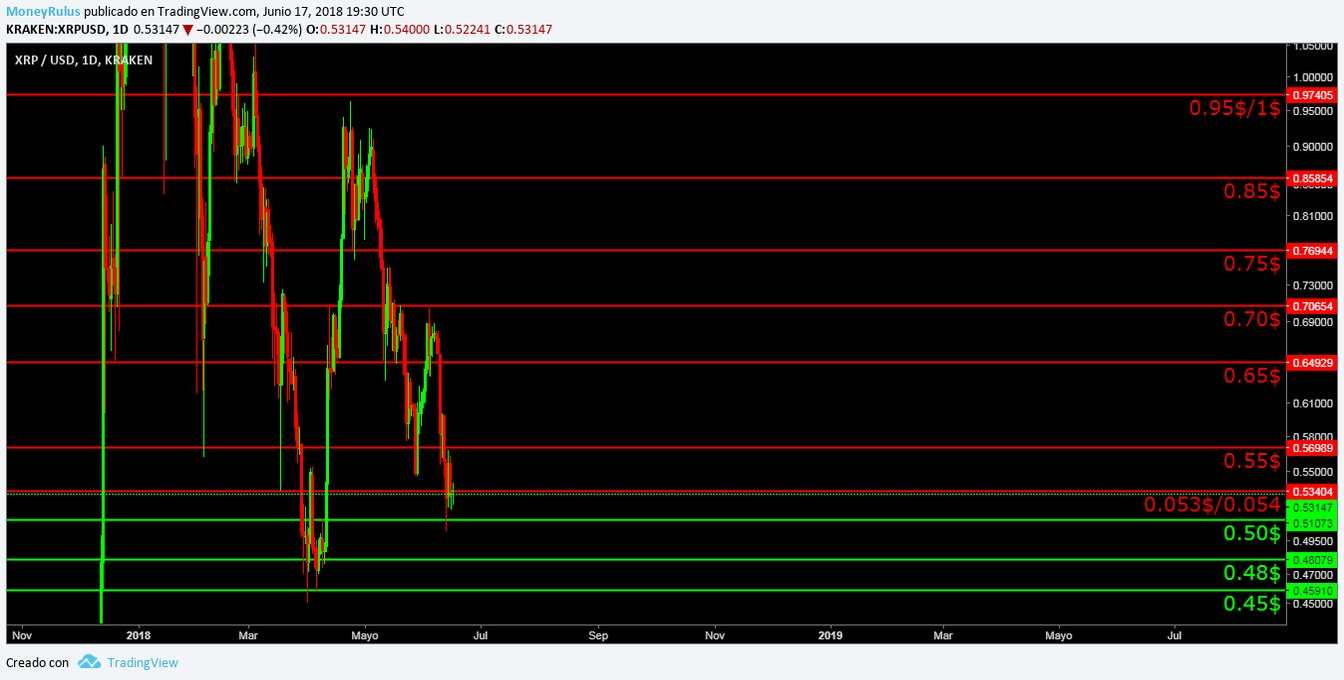
- If the price falls it can find some supports in the areas of $ 0.50, $ 0.48 and $ 0.45. Areas that despite being less than the resistances, can be very important.
- In case of ascending, the resistance could be found in the areas of 0.053 $ / 0.054, 0.55 $, 0.65 $, 0.70 $, 0.85 $ and 0.95 $ / 1 $. Areas that are strong and varied; no doubt very careful strips.
Bitcoin Cash, BCH / USD
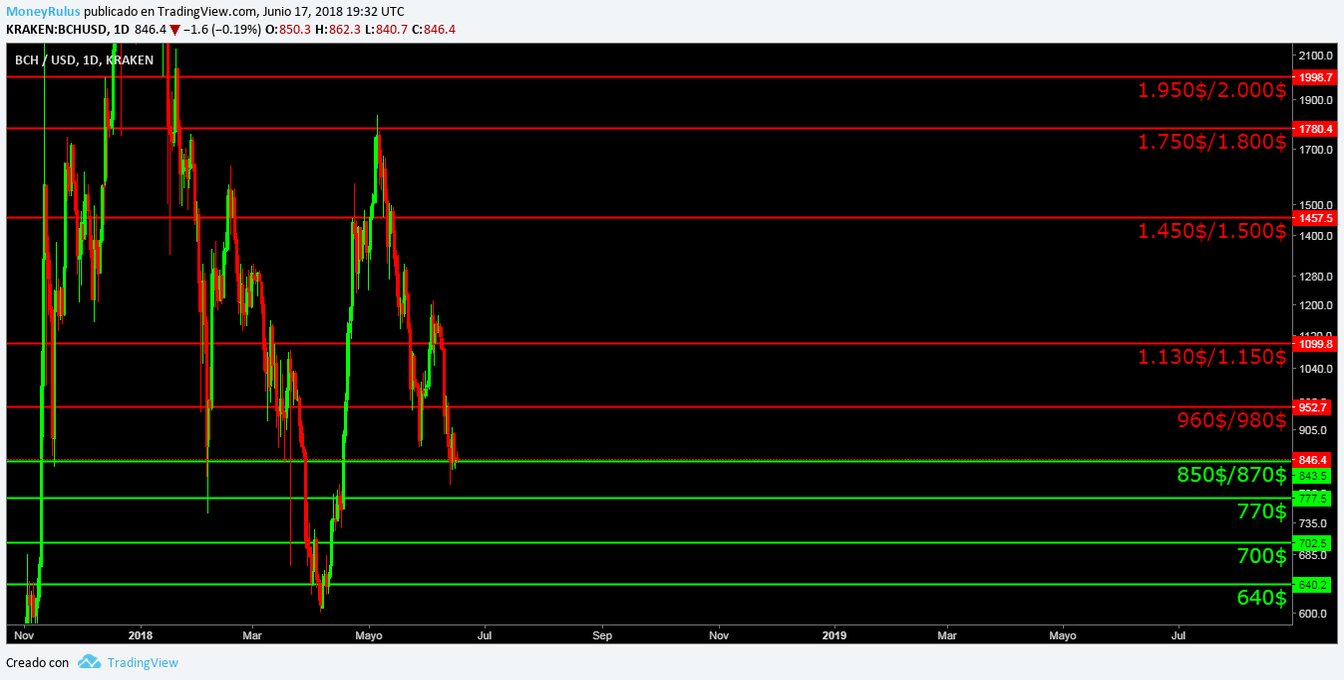
Admiring the pair BCH / USD in the Kraken exchange house it remains firm with the triangular pattern that we have been observing. At this moment the price is in the lower part of it, on the support that is personified by the green trend line.
If the price bounces in that area, by the action of the bulls, it is possible that it is directed to the upper part of the triangle, to fight with the resistance symbolized by the orange trend line. In this area the bears can exert greater influence and increase the pressure of sales, to ensure that the market fails to drill the possible ceiling.
The volume contracts supporting the triangular pattern, as with the pair XRP / USD, which we have already discussed.
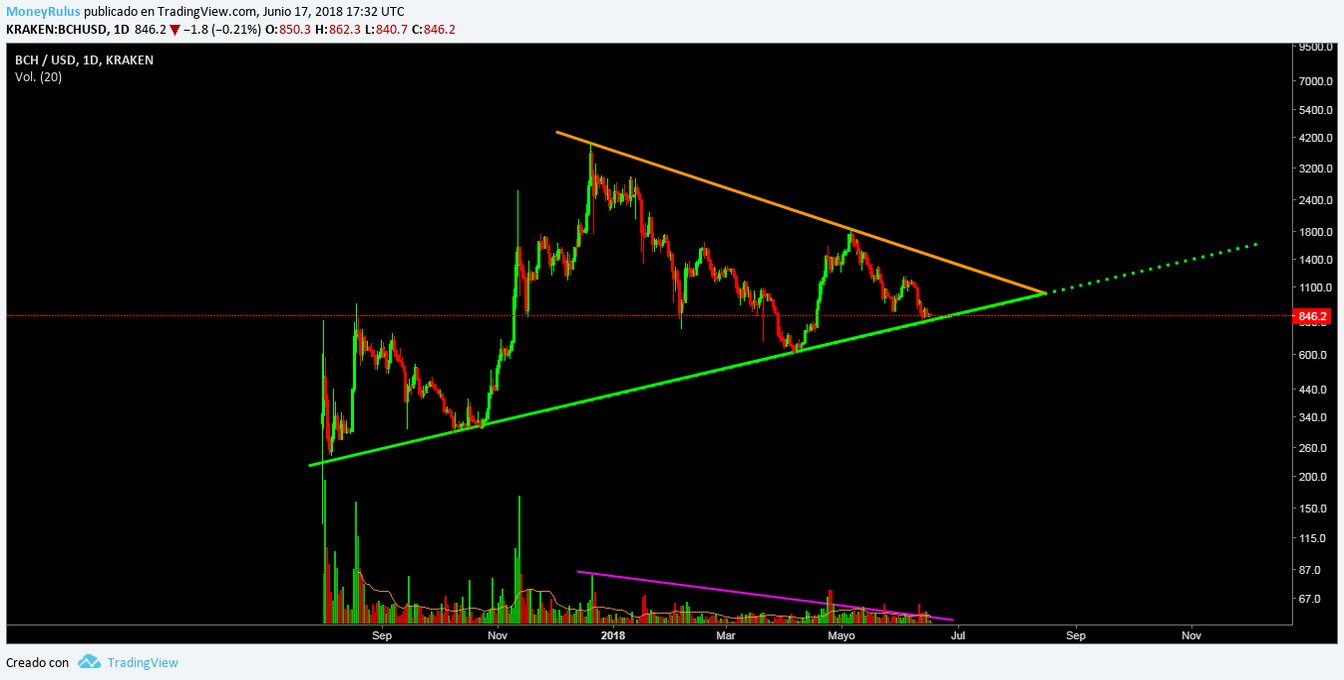
- In case of a rebound of the bearish trend, the currency can discover supports in the areas of $ 850 / $ 870, $ 770, $ 700 and $ 640. Areas that may be the retaining walls for bears.
- If the bulls manage to make a spike, they can find dynamic resistances in the areas of $ 960 / $ 980, $ 1,130 / $ 1,150, $ 1,450 / $ 1,500, $ 1,750 / $ 1,800 and $ 1,950 / $ 2,000.
EOS, EOS / USD
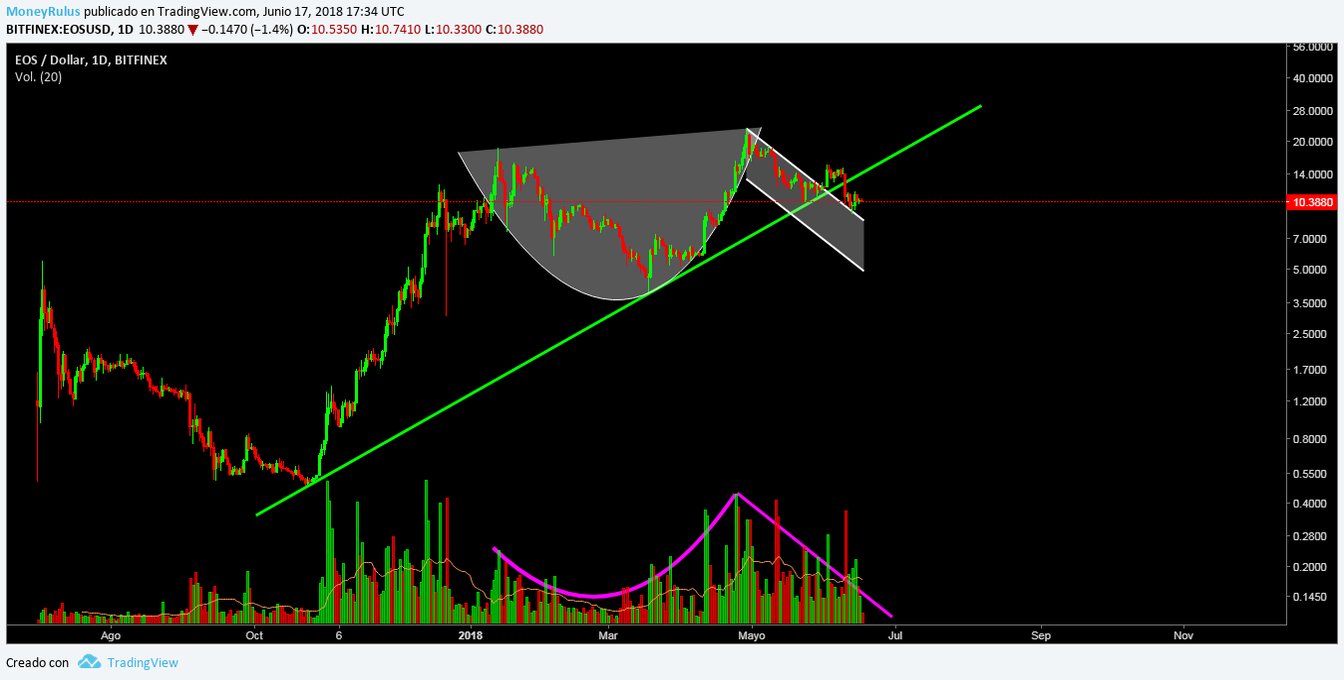
The pair EOS / USD in the BitFinex exchange house remains like BCH, strong with the pattern that shows. At this moment, the price seems to be doing a Throw back, due to the clear influence of the bears, to the upper part of the channel that makes up the Handle, of the possible Cup & Handle pattern that we have been studying.
Once the re-testing of the area is done, the ideal is for the price to rise and break the historical maximums to complete and validate the pattern. While the pattern so far is going very well, do not forget that the price broke the green trend line, which served as a long-term support, so if now that line is under the control of bears, without a doubt it will be a hard resistance to crack, if the bulls do not demonstrate a force worthy of it.
The volume supports the pattern very well, but the last few days show some contraction, which may be important in the future.
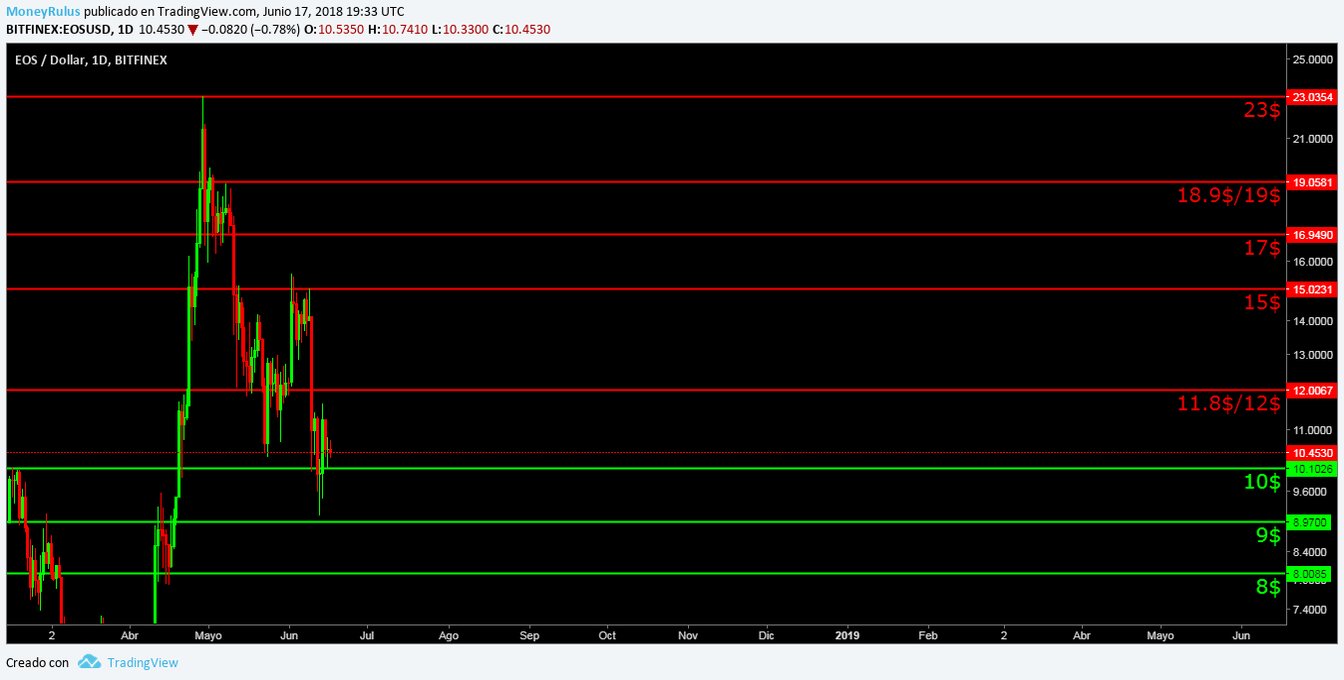
- In case of staying down, supports can be presented in the areas of $ 10, $ 94 and $ 8. Areas that can be very useful for bulls.
- If the price decides to go up, it can find resistances in the areas of $ 11.8 / $ 12, $ 15, $ 17, $ 18.9 / $ 19 and historical highs at $ 23. Areas in which bears will have the advantage.
 Litecoin, LTC / USD
 Litecoin, LTC / USD
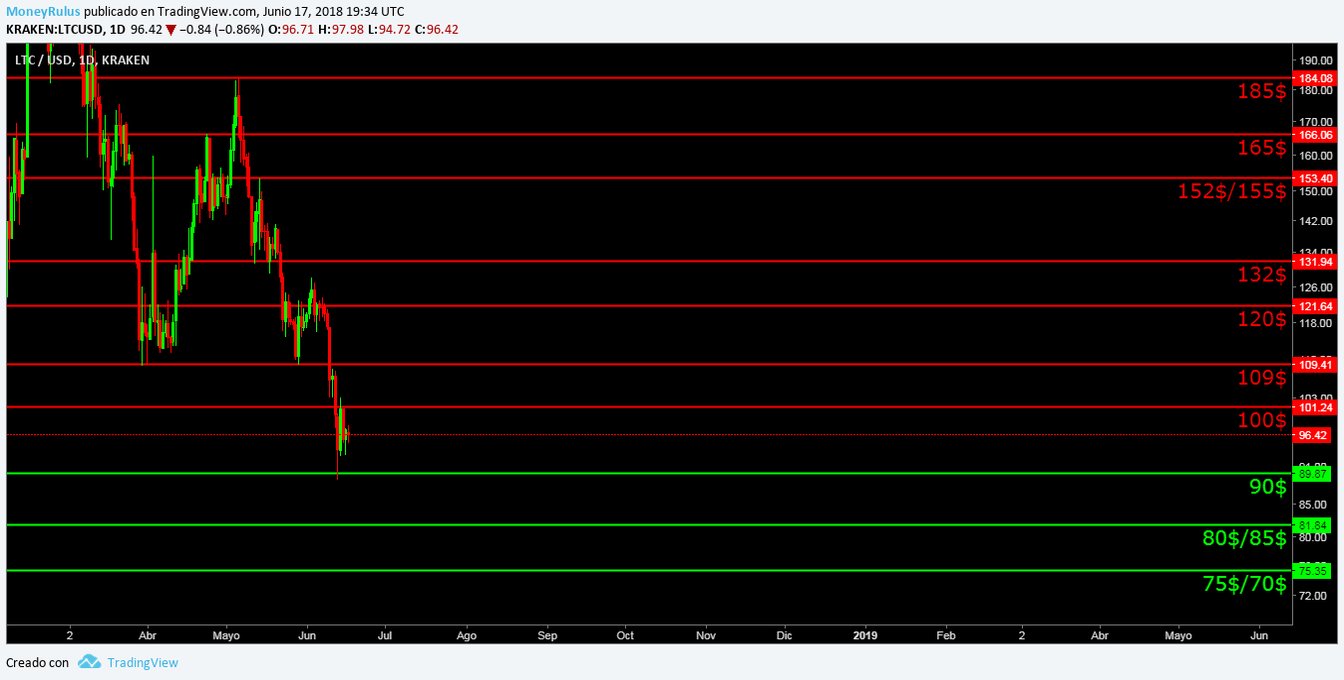
Visualizing the LTC / USD pair in the Kraken exchange house, it presents, without a doubt soemthing interesting, the price bounced on a very strong support (thanks to the almost indefatigable resistance of the bulls) represented by the blue trend line, this support it is long term, so its importance is not at all negligible.
It seems to draw a triangular pattern together with the resistance, exemplified by the yellow trend line, which is achieved by joining the latest LTC maxima.
If the price bounces in this area, it can head to the bottom of the green riser, an area that along with the same resistance that creates the yellow trend line, can be a possible roof, an area where bears can exert practically voracious control over the price, to stop the advance of its rivals.
The volume supports the idea of the possible triangular pattern that we have already discussed, so it is not farfetched. The ideal is to be patient and wait for confirmations.

- A group of brave supports are presented in the areas of $ 90, $ 80 / $ 85 and $ 75 / $ 70.
- And the resistances work in their own way, since they are in the areas of $ 100, $ 109, $ 120, $ 132, $ 152 / $ 155, $ 165 and $ 185. Numerous and strong, undoubtedly a challenge worthy of the bulls that will face them.
Cardano, ADA / USD
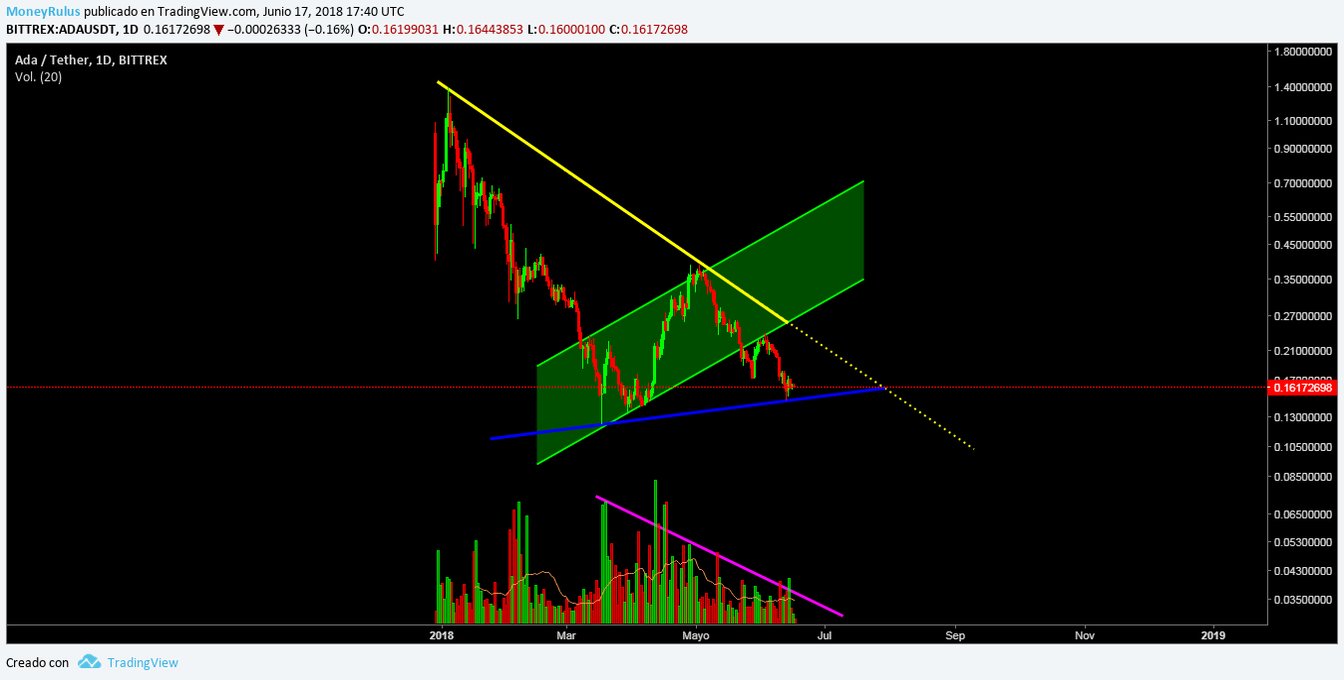
The ADA / USD pair at the Bittrex exchange house is curious. The price bounced on a very interesting mid-term support (an area in which the bulls seem to have revived ipso facto, represented by the blue trend line.
This area is now defined as an attractive soil, despite that, the price broke the green ascending channel, downward, so at this time it is presented as a resistance that will have to face the bulls, in the case if they have enough power, to get the price to rebound with such force as to approach the area.
In addition to the lower part of the channel, there is also the clear resistance represented by the yellow trend line, this area is a clear domain of the bears, so if the bulls manage to get the price to reach the area, just then, the real battle will hardly begin.
The current support exemplified by the blue trend line, and the standing resistance, represented by the yellow trend line, seem to have formed a very interesting triangular pattern. Pattern that is visible, has the support of volume, something that adds greater seriousness to it.
Let’s wait for the decisions of the market to act prudently.
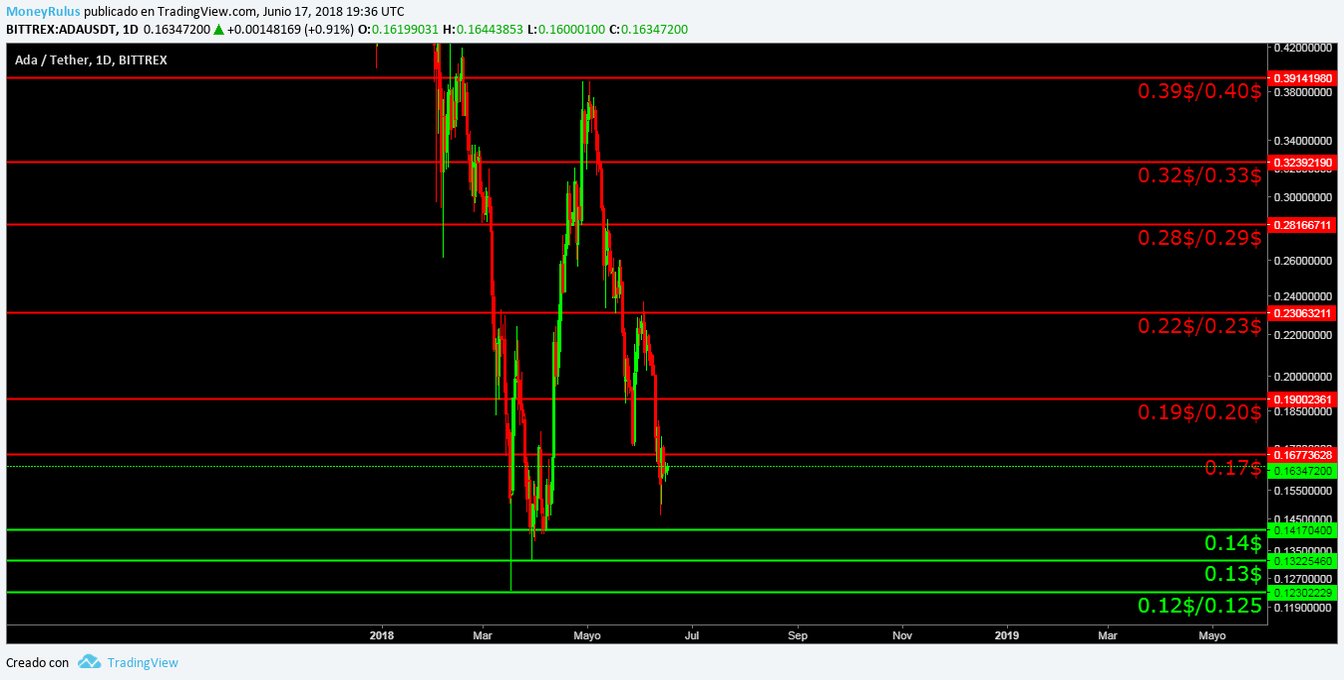
- Allied supports can be presented in the areas of 0.14 $, 0.13 $ and 0.12 $ / 0.125. If the bears manage to get beyond the last support, the market would be in a completely unexplored area, a place where you do not know, what could happen.
- If the bulls show a certain strength, the price may find resistance in the areas of 0.17 $, 0.19 $ / 0.20 $, 0.22 $ / 0.23 $, 0.28 $ / 0.29 $, 0.32 $ / 0.33 $ and 0.39 $ / 0.40 $ . The last resistance is also the historical maximum, so if the bulls manage to break it, the price would also be in unknown territory.
Stellar Lumens, XLM / USD
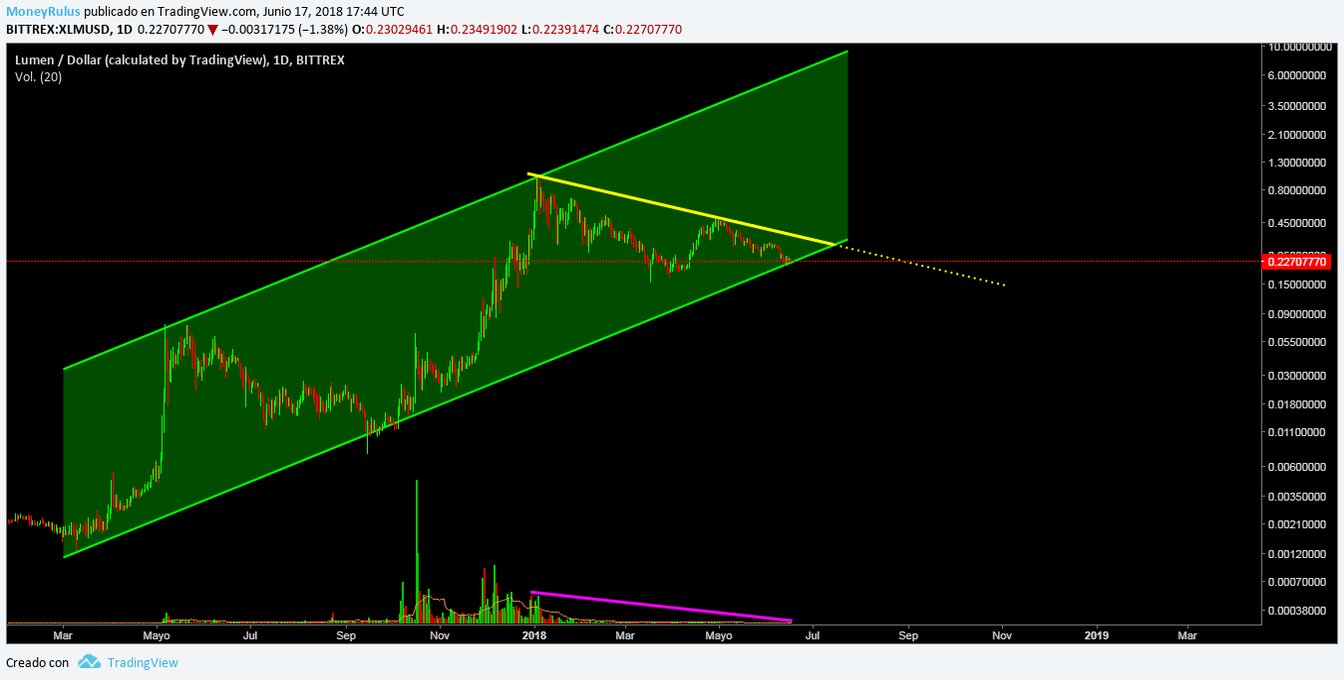
The pair XLM / USD in the Bittrex exchange hourse shows something attractive, the price seems to be in a giant ascending channel of green color.
The same channel serves as support and resistance for the price. At this moment it seems that the same re-tests the lower part of the channel to see if it can find any support in that area. If the bulls resist the pressure of the selling pressure, that area it can be constituted as a support once more, as it has been several times in the past.
In addition to that, there is also a resistance that crosses the green channel diagonally, resistance that is exemplified by the yellow trend line, which joins the last XLM maxima. This trend line is under the control of the bears, so if the bulls get the price to rebound in the lower part of the channel, they must defeat the bears in this area, to allow the price to go to the top of the channel.
It also seems that a triangular pattern is being created between the channel and the resistance, a pattern that has the support of the volume, although the truth in recent times has become almost a legend, since it practically shines by its absence.
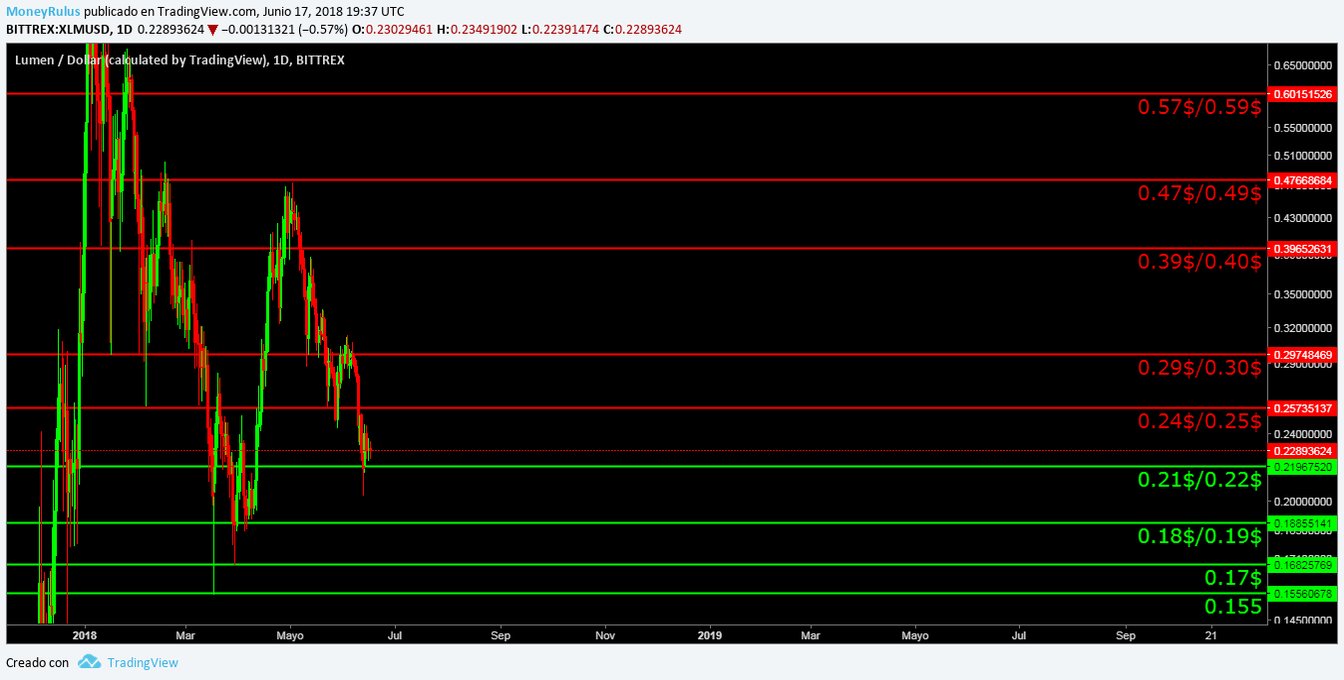
- Potential supports are presented in the 0.21 $ / 0.22 $, 0.18 $ / 0.19 $, 0.17 $ and 0.155 $ areas. Zones that can be value trenches.
- And on the other hand, resistances can be seen at 0.24 $ / 0.25 $, 0.29 $ / 0.30 $, 0.39 $ / 0.40 $, 0.47 $ / 0.49 $ and 0.57 $ / 0.59 $.
IOTA, IOTA / USD
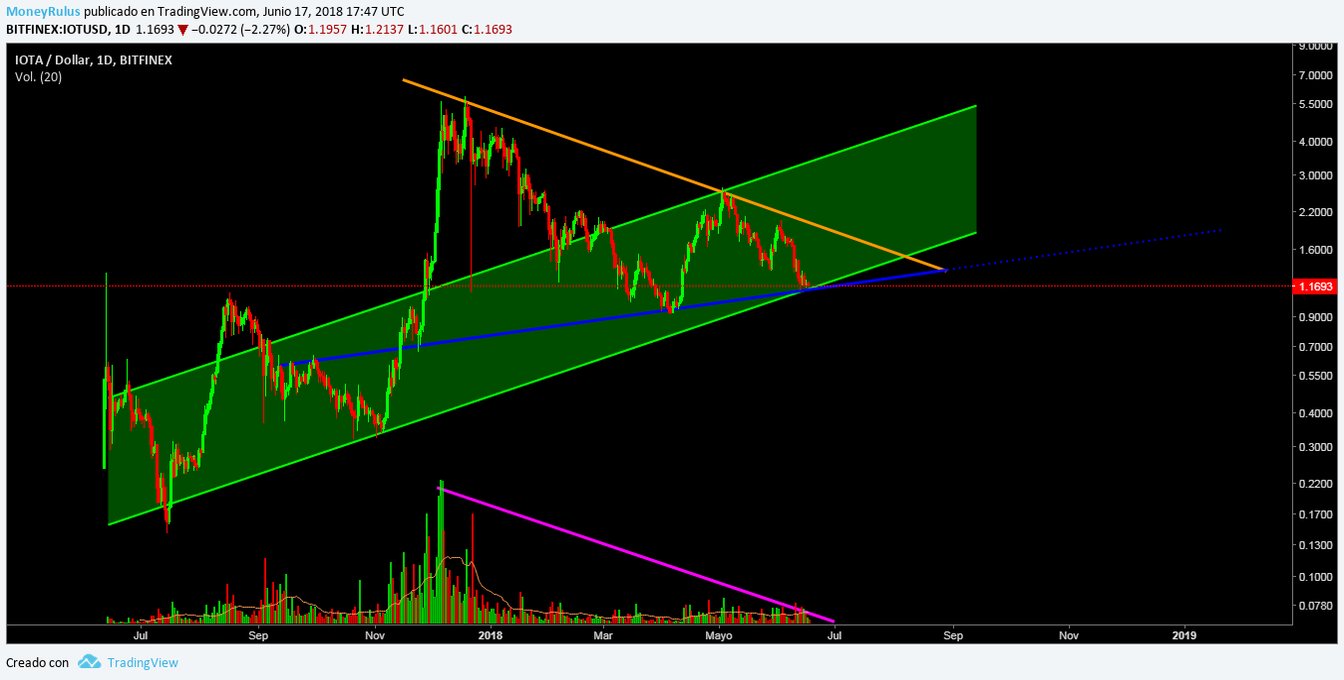
The pair IOTA / USD in the BitFinex exchange house, shows a clear green ascending channel, in which the price seems to be bouncing. In this area the bulls can be making an effort so that the price finds ground and stops the fall that brings Since a few days.
In addition to the lower part of the ascending channel, in the same band there is a very strong coincidence with a long-term support, symbolized by the blue trend line. This trend line is of great importance since it is not unknown. Additionally, the orange trend line that represents a clear resistance, an almost absolute domain of the bears, is also presented.
Both trend lines seem to be showing a triangular pattern just like in other currencies that we have seen. It has the support of the volume which is undoubtedly a very good sign, but it is not a guarantee of anything, since the bears have shown a lot of force in the last days, so they could invalidate the pattern, as they have done with many others in the past.
The best idea is to wait for the confirmations, since that way you act safe.
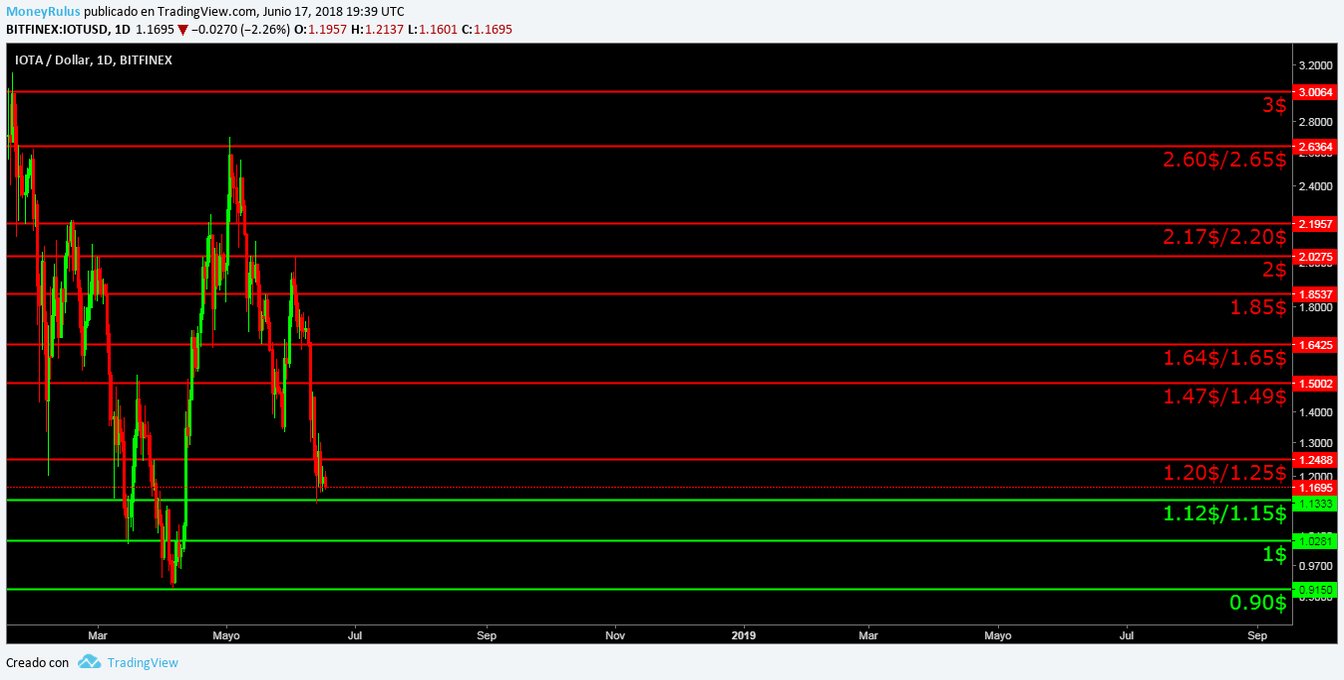
- In case the bears remain in control of the market, the price can find supports in the areas of $ 1.12 / $ 1.15, $ 1 and $ 0.90. The $ 1.12 / $ 1.15 range is the last floor of the coin, so it may be a possible point of sustenance in the future.
- Also, if the bulls take over the reins, the price may find resistance in the areas of $ 1.20 / $ 1.25, $ 1.47 / $ 1.49, $ 1.64 / $ 1.65, $ 1.85, $ 2, $ 2.17 / $ 2.20, $ 2.60 / $ 2.65 and $ 3. Areas that can be complex to break and even to pierce.
Tron, TRX / USD
To conclude let’s talk about TRX / USD in the Binance exchange house. At this moment it may be bouncing on a long-term support, which is represented by the green trend line. It has been a floor in other times in the past so it could undoubtedly be one again if the bulls collect enough strength to make the price rebound in this area, without doubt they can fight later against the bears.
In addition to that, the orange trend line continues to symbolize a strong resistance linking the last TRX highs, this is an area where bears could beat the bulls, if the bulls do not have enough strength to face them.
Both trend lines create a possible triangular pattern that can be very attractive, the volume supports this possibility, so it does not look at all crazy.
Still, the fact of, does not imply the what; It is still possible that bears invalidate the pattern, so it is not yet appropriate to make decisions based on it.
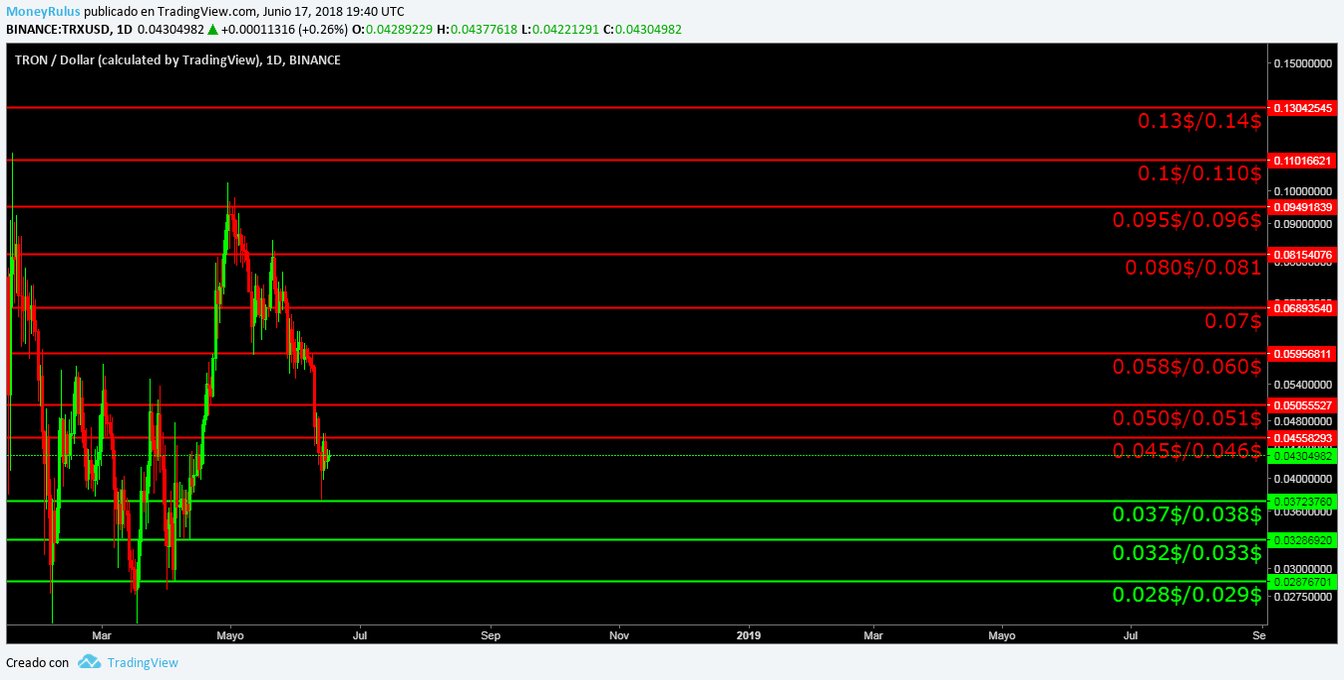
- The currency could find supports in the areas of 0.037 $ / 0.038 $, 0.032 $ / 0.033 $ and 0.028 $ / 0.029 $. Price zones where the bears will have to fight, to determine who triumphs.
- Concluding, in case the bulls decide to make a rebound in the price, there may be resistances in the areas of 0.045 $ / 0.046 $, 0.050 $ / 0.051 $, 0.058 $ / 0.060 $, 0.07 $, 0.080 $ / 0.081, 0.095 $ /0.096$, 0.1 $ / 0.110 $ and 0.13 $ / 0.14 $. Areas that undoubtedly can be strong rivals in the advance of the bulls. A mere reflection of the market in general.