It couldn’t get worse for Bitcoin prices. When writing, the coin is down a massive 30 percent from November 2021 peaks–and bears look like they aren’t slowing down.
Technically, BTCUSDT price action strongly favors sellers—unless there is an unexpected formation thrusting the coin higher—plugging the bleed.
Inflation Rising in the U.S., BTC Remains Under Pressure
Technically, the digital gold is under pressure. Buyers are feeble, failing to sustain prices above the psychological $50k line and $53k—a crucial resistance, former support.
The crash of Bitcoin prices was expected. After a stellar performance in 2021 fueled by, among many factors, inflation concerns, the pullback may be a healthy development.
Surprisingly, it comes amid news from the United States that consumer prices rose the fastest in the last four decades.
Year-to-date, consumer prices increased 6.8 percent last month from November 2020. The expansion temporarily supported BTC prices which then dumped in the late New York session.
Still, many new investors consider Bitcoin a hedge against inflation. The U.S. inflation rate has been above the two percent mark in recent months. The FED chair, Jerome Powell, thinks the rise is transient and would taper over the months going into 2022.
Bitcoin Hash Rate at New All-Time Highs
The decline in prices is not preventing new miners from plugging into its network. While BTC contracted below $50k, the network’s hash rate expanded to new all-time highs.
BREAKING: #Bitcoin hash rate has made a new all time high.
A little over six months following the China mining ban, the #Bitcoin Network is stronger than ever before. pic.twitter.com/1uHnNPHh3C
— Dylan LeClair 🟠 (@DylanLeClair_) December 10, 2021
It comes only a few months after miners shut down in China, shifting their gear to other countries, thereby allowing the U.S. to be the epicenter of BTC and cryptocurrency mining.
Bitcoin Price Analysis
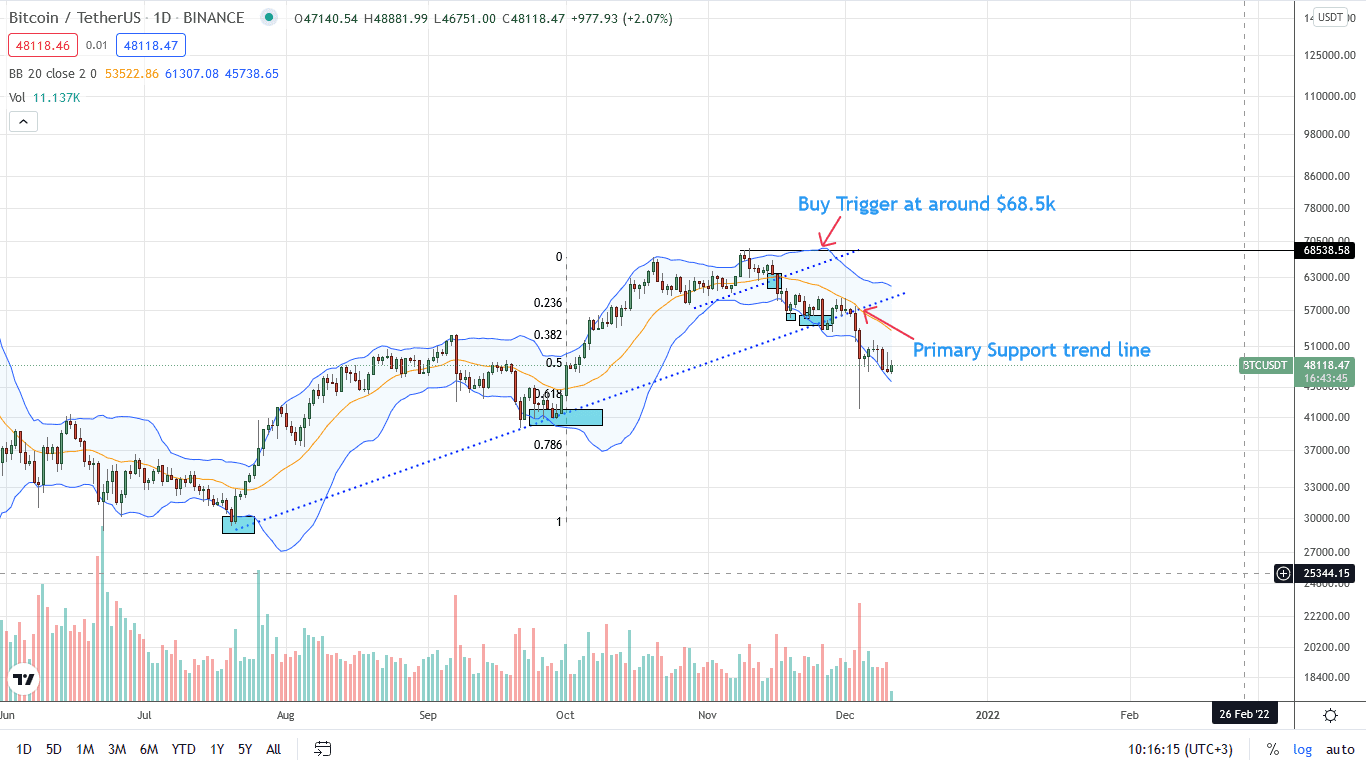
The BTC price is down 30 percent from November 2021 peaks, trading within a bear break out pattern, evident in the daily chart.
As it is, the December 4 bear candlestick and last week’s trend formation are setting the motion for the current price action.
Since BTC bulls didn’t recover to unwind losses and are still within last week’s trade range, sellers have the upper hand.
From an Effort-versus-Results perspective, every high below $54k and December 4 peaks may offer entries for sellers targeting $42k—Last week’s lows and even $37k—the 78.6 percent Fibonacci retracement level of the H2 2021 trade range.
The only shift in trend is if prices recovery from spot rates to reclaim $54k pumped by above-average trading volumes. This will nullify selling pressure from a volume analysis, re-injecting momentum in the current price action.
Technical charts courtesy of Trading View
Disclaimer: Opinions expressed are not investment advice. Do your research.
If you found this article interesting, here you can find more Bitcoin news


