There has been a revival in the cryptocurrency market and most importantly, Bitcoin’s price action, as observed over time, not only determines the direction of the altcoin market thanks in part to its direct correlation, but influences investor sentiment. At the depth of last week’s bear market that was worsened early this week, investor confidence was at rock bottomed.
Sell Pressure from Plus Token Ponzi scheme
Many analysts feared for the worst, projecting prices to sink to new lows and even below 2018 lows.
Behind the liquidation were fears that the acts behind the Chinese Ponzi scheme had allegedly embarked on a dumping spree as they sought to stay ahead of law enforcement before the law caught up with them.
This, as the law of supply and demand dictates, would have a negative effect on price, diffusing bear pressure and keeping prices low to the frustration of the market.
Although miner profitability is around the $4,000 mark and therefore those mining with the latest gear are deep in green even at spot prices, the likelihood of further price deeps had been kept at bay thanks to highlights drawn from the Bitcoin Futures market.
Bitcoin Futures at BitMEX points at Bulls
Highlighted before, the one month and the three months BTC settled and cash settled futures at BitMEX were available at a premium.
This meant the traders were expecting for high prices ahead of this month’s close and through to Q1 2020.
If this is then incorporated and used to project the possible direction of BTC going forward, positives can be painted.
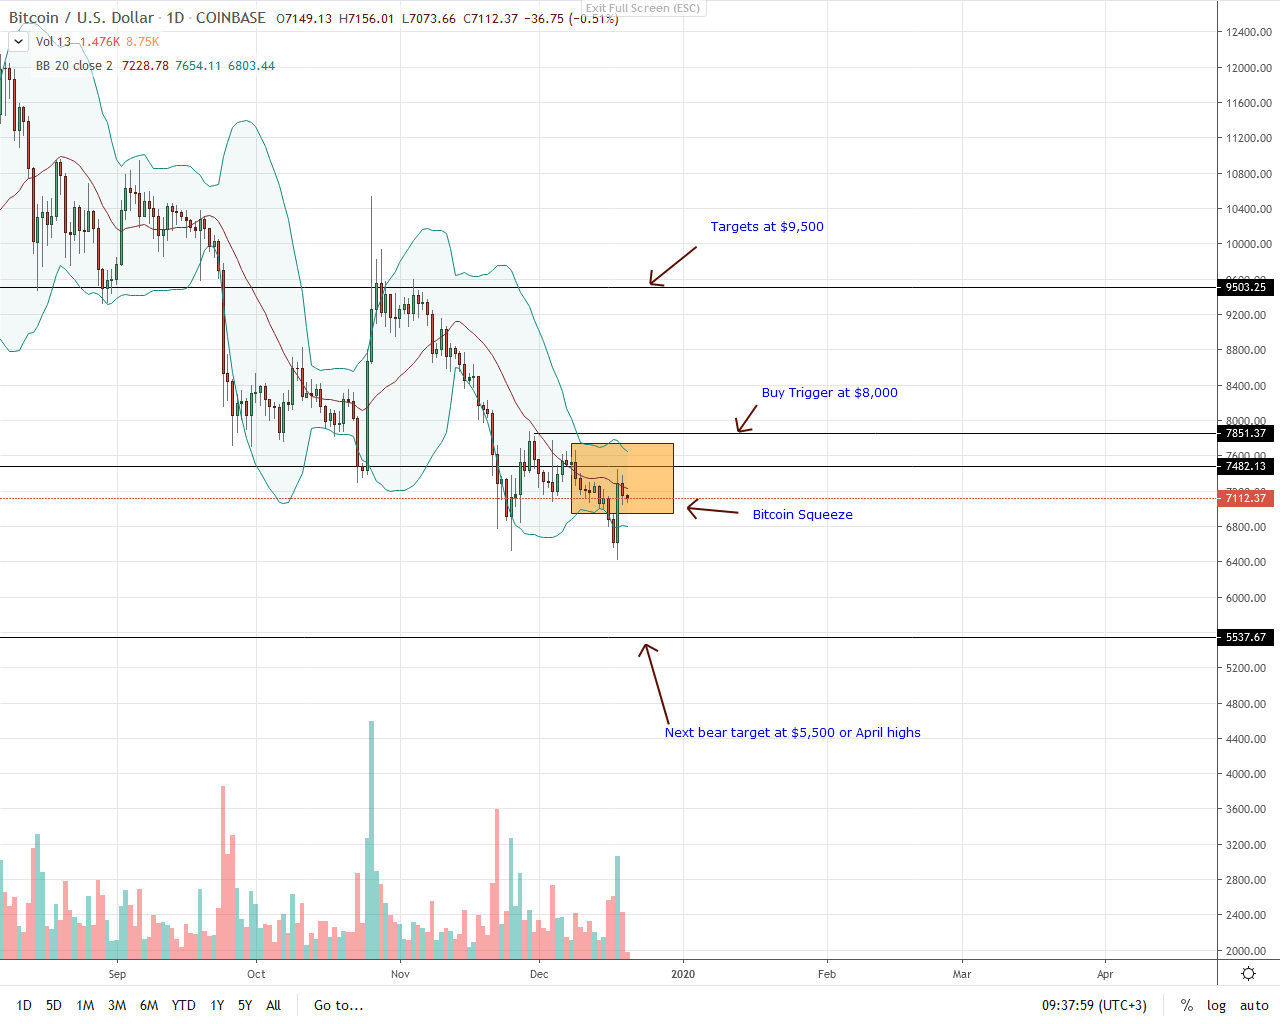
BTC/USD Price Analysis
Bitcoin’s strength is evident from the reaction of altcoins in the top 100. Only but a few coins were able to match BTC bulls. Against the USD, BTC bulls were clear winners.
Relatively stable after impressive gains of Dec 18, BTC is up 78% year-to-date against the USD.
This can be further stretched judging from candlestick arrangement in the daily chart. There is a double bar bullish reversal pattern as prices reverse from November 2019 low.
Marking the resurgence is a huge bull candlestick with above average trading volumes that not only completely eclipses losses of Dec 17 but overwhelmingly corrects the undervaluation of Dec 16.
With this arrangement clear, risk-off traders can begin building their longs, buying the dips with fitting stops at around $6,500-$6,700 support zone.
In this setup, the first target will be $7,900 and later $8,500. On the other hand, conservative traders will find reason to ramp up once there are strong gains above $8,000, an important resistance level. There, the first target will be $9,500 and later $12,000 or so.
Chart courtesy of Trading View—Coinbase
Disclaimer: Views and opinions expressed are those of the author and is not investment advice. Trading of any form involves risk. Do your research.