Vitalik Buterin is known for his subtle digs. He has been slammed for his “authoritarianism” before. But unlike Justin Sun, the co-founder of Tron, his theatrics are few, well-thought, and sometimes controversial.
Vitalik dismissing Stock-to-Flow Model
It appears that he is against crypto price prediction models and specifically the Stock-to-Flow ratio indicator.
He says it the model is full of post-hoc rationalized bullshit, joining another leading crypto influencer who discredited the indicator for similar reasons.
Market Forces and Halving to Propel BTC Higher
The Stock-to-Flow ratio is a model just like any other. It takes into consideration the scarce Bitcoin in circulation to make a prediction.
Bitcoin has a fixed supply of 21 million coins. The lower the supply, the higher the demand. With high demand, it means the price of the underlying must be repriced as the market strikes equilibrium.
This ratio will edge higher and near gold’s once the Bitcoin network halves. As a result of low demand, BTC stands to rally.
Bitcoin at $100k in the next few years
According to the model, the price of the most valuable digital asset will be in the $100k zone in the next two to three years or so.
Because of these very optimistic forecasts, Vitalik seems to take issue with the indictor and pundits taking every opportunity to point to the moon when disaster strikes.
The market, in his observation, is full of articles predicting Bitcoin prices and “flow to safety” due to coronavirus, a move that rubs the Vitalik co-founder the wrong way, terming it as creepy.
BTC/USD Price Analysis
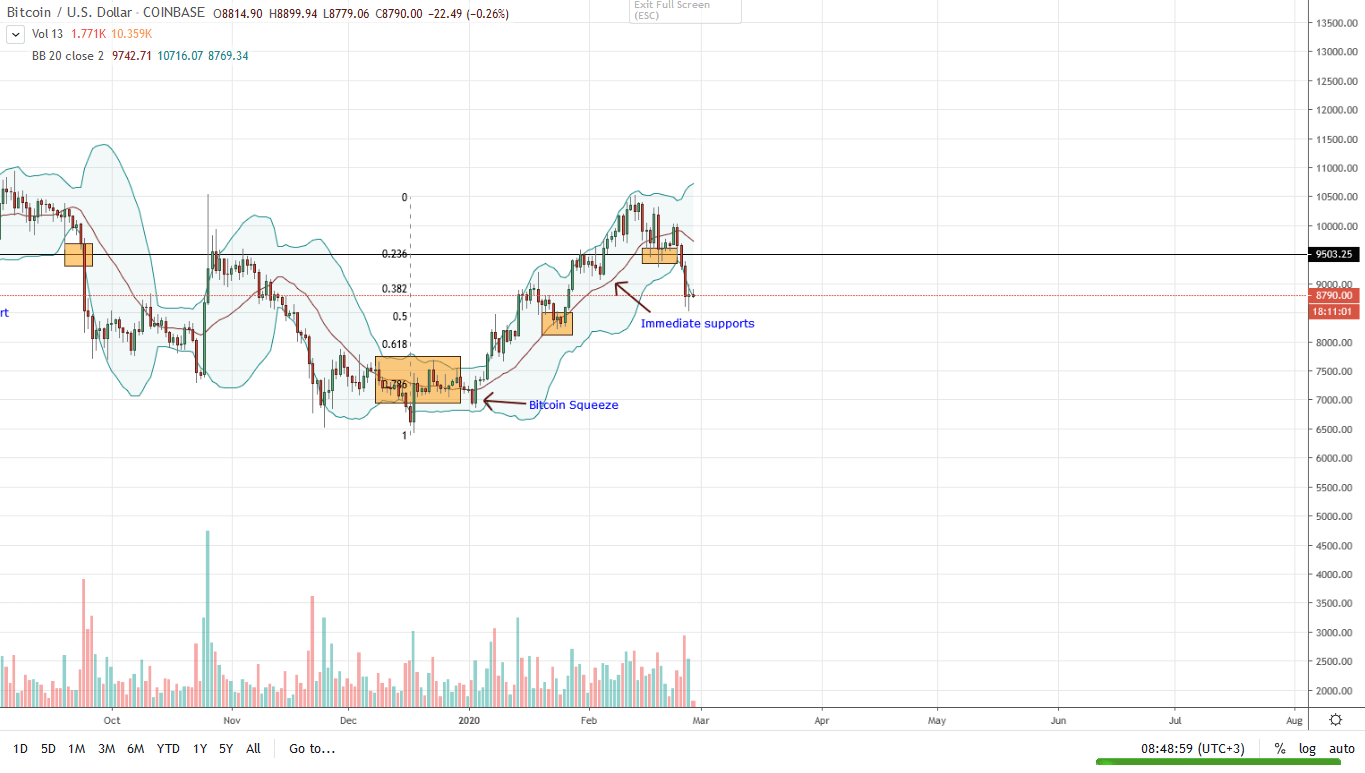
BTC price is steady and likely to correct higher. In the last week, BTC is down 7% as bears reign supreme.
Specifically, in the daily chart, sellers are in control, driving prices lower. However, there seems to be a correction and an undervaluation.
In the daily chart, yesterday’s bull bar closed below the lower BB. This happens 5% of the time according to the indicator’s creators. Because of this, a correction higher is highly likely as the market searches for equilibrium.
Again, yesterday’s lows reversed from the 50% Fibonacci retracement level, an important reaction point.
Although the bear momentum is high, any reversal above Feb 26 bear candlestick amid high trading volumes could see BTC rally to $10,500.
On the flip side, any sell off below $8,500 with high participation could trigger another wave of liquidation towards $7,800.
Chart courtesy of Trading View-Coinbase
Disclaimer: Views and opinions expressed are those of the author and is not investment advice. Trading of any form involves risk. Do your research.


