
Latest Bitcoin News
If crypto and Bitcoin is a bubble then it has been popped. The double-digit losses of the last few days at the back of super high trading volume has been enough to drive BTC/USD prices to new lows. Therefore, whether this is a lasting correction or a lull in the grand scheme of things, we are yet to see.
After all, losses like these are common in this scene and it seem like this drop is a replica of the same price movement that printed out in 2014. Then prices did rise driving the whole market cap to $13 billion before diving back to $3 billion padding the foundation for the next rally that took BTC prices to $20,000 pumping the total crypto market cap to $850 billion.
Thing is, it is still too early to make calls. The market is nascent and regulators in most jurisdictions are trying to understand how Bitcoin and similar products laid on the blockchain work and how to best protect investors.
Add this to hacks and scams that took advantage of the ICO hysteria of last year and we understand why institutions-though tracking crypto-are reluctant to venture. Secondly, we aren’t sure if this market valuation is a reflection of what investors/institutions think of Bitcoin value proposition or whether this drop is but a necessary sting to weed out weak hands and drive crypto to super new highs confirming Tim Draper’s insistence of $250,000.
BTC/USD Price Analysis
Weekly Chart – BTC/USD price prediction
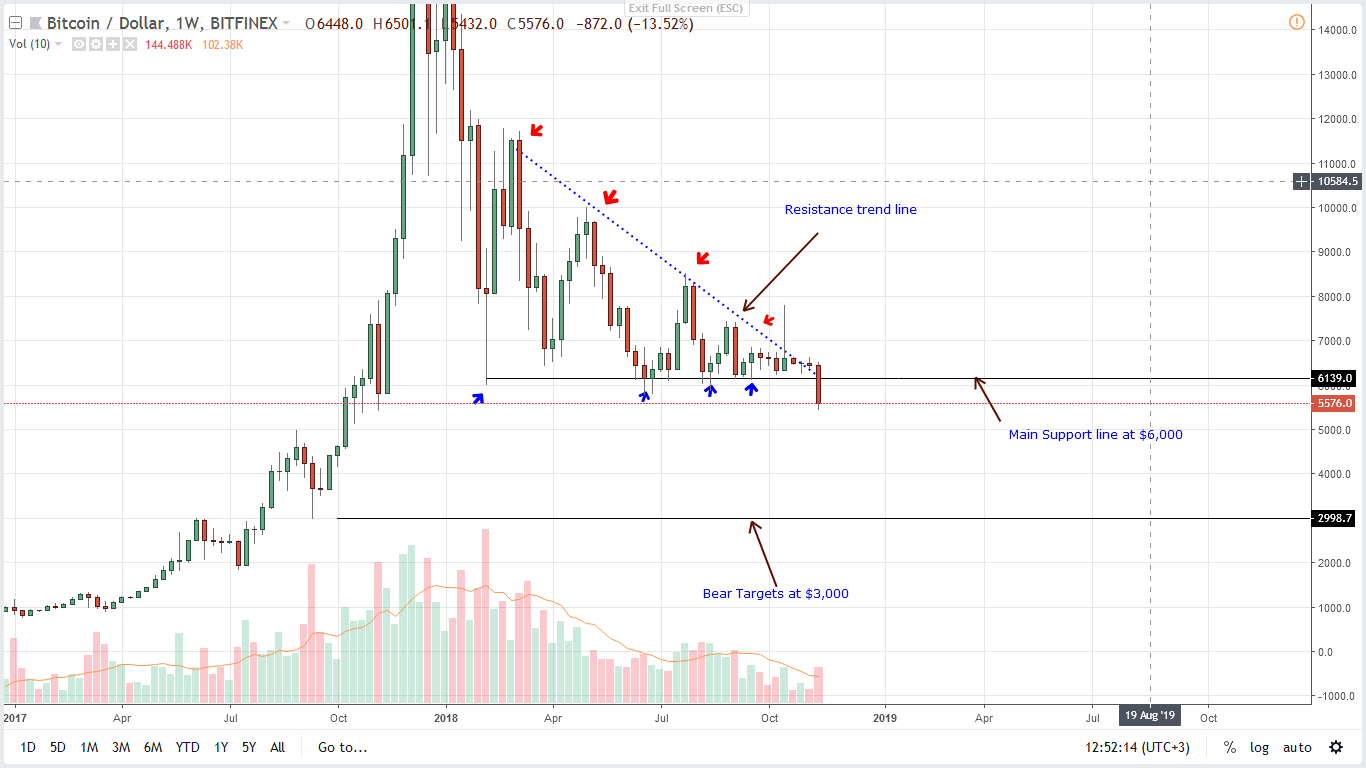
Before Nov 14 declines, we were positive of a recovery all thanks to week ending Oct 21 and more specifically events of Oct 15 that caused investors to move their funds from USDT—a stable coin to Bitcoin—a liquid asset which is also a store of value. Then prices temporarily raced above $7,200 triggering buys but then sank days after.
Since BTC/USD prices were maintained above $6,000 and consequent bars did close above the main resistance trend line, then our bullish overview was valid. However, we maintained our position that losses below $5,800 or 2018 lows would trigger bears and since it has been met, we shall recommend sells with first targets at $4,500 and later $3,000.
From the chart we have ideal trade conditions with prices now trading below our sell trigger level at the back of strong volumes validating our last BTC/USD trade plan.
Daily Chart – BTC/USD price prediction
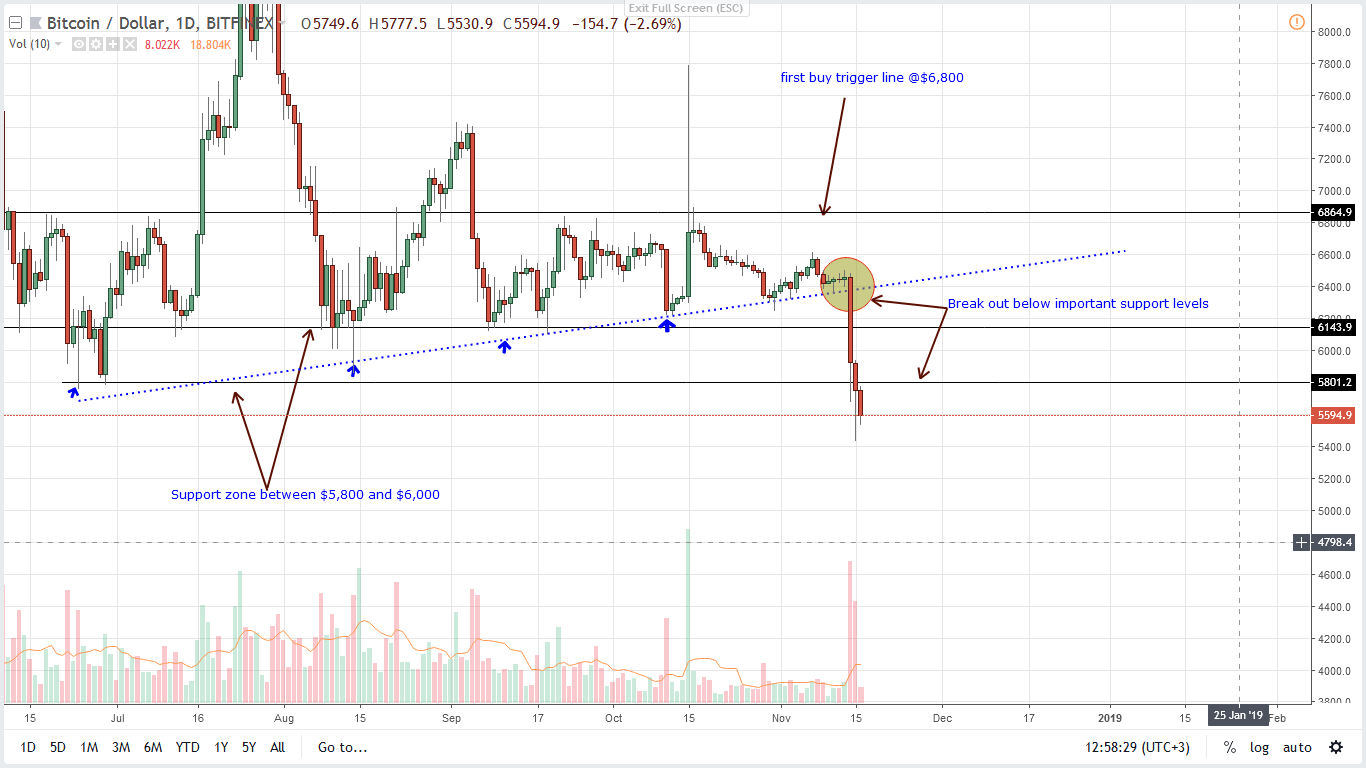
The bear breakout trade is clear in the daily chart thanks to Nov 14 steep losses which lead to breaks below two levels of support at $6,000 and later $5,800.
Everything else constant, every pullback should theoretically be another selling opportunity. Then again, since the Bitcoin Cash hash war is now over and the chain has split, we expect prices to stabilize but still shorting at spot with stops at $6000 is safe enough.
First targets will be $4,500 and later $3,000.
All Charts Courtesy of Trading View
Disclaimer: Views and opinions expressed are those of the author and aren’t investment advice. Trading of any form involves risk and so do your due diligence before making a trading decision.