Higher Highs
After a bloodbath, it’s that time of the year where traders would ideally slow down and reflect after last week’s battering. But if technical candlestick arrangements offer guidance, the future looks bright.
After last week’s fall, BTC price sunk to a 6-month lows. However, savvy traders seem to have found an opportunity to amass BTC for cheap.
In an accumulation, Bitcoin is finding support. Up 8.5 percent in the last day, price action points to bulls, a reversal. Admittedly, that is what the market yearns for.
Although prices have more than doubled after touching $3,200 in last year’s biting crypto winter, there are analysts who are unconvinced of the recent recovery.
Terming it as a dead cat bounce that only fuels shorting, BTC could fall to below $2,800 before reversing higher. On the other hand, there are optimist.
Stock-to-Flow Model Supportive of Bulls
These class of supporters are mostly technical analysts who are convinced that the BTC market is ready for a rally.
Behind their reasoning is a spike in trading volumes in the last few trading days and next year’s halving.
According to PlanB, an advocate of the Stock to Flow price model, an indicate that measures the scarcity of an asset that has a hard cap, BTC could rise to over $10,000 by the end of the year.
His view was collaborated by one of Germany’s leading banks, Bayern LB, who argue in a report that the reduction in daily supply will mean a rise in S2F ratio, placing Bitcoin’s market cap at over $1 trillion.
At those rates, BTC is currently undervalued and if the model is correct, ready for a 15X price expansion going forward to $90,000 apiece.
BTC/USD Price Analysis
Aforementioned, Bitcoin bulls are back. Week-to-date, the coin is still in red. However, in the last 24 hours, price is pretty stable.
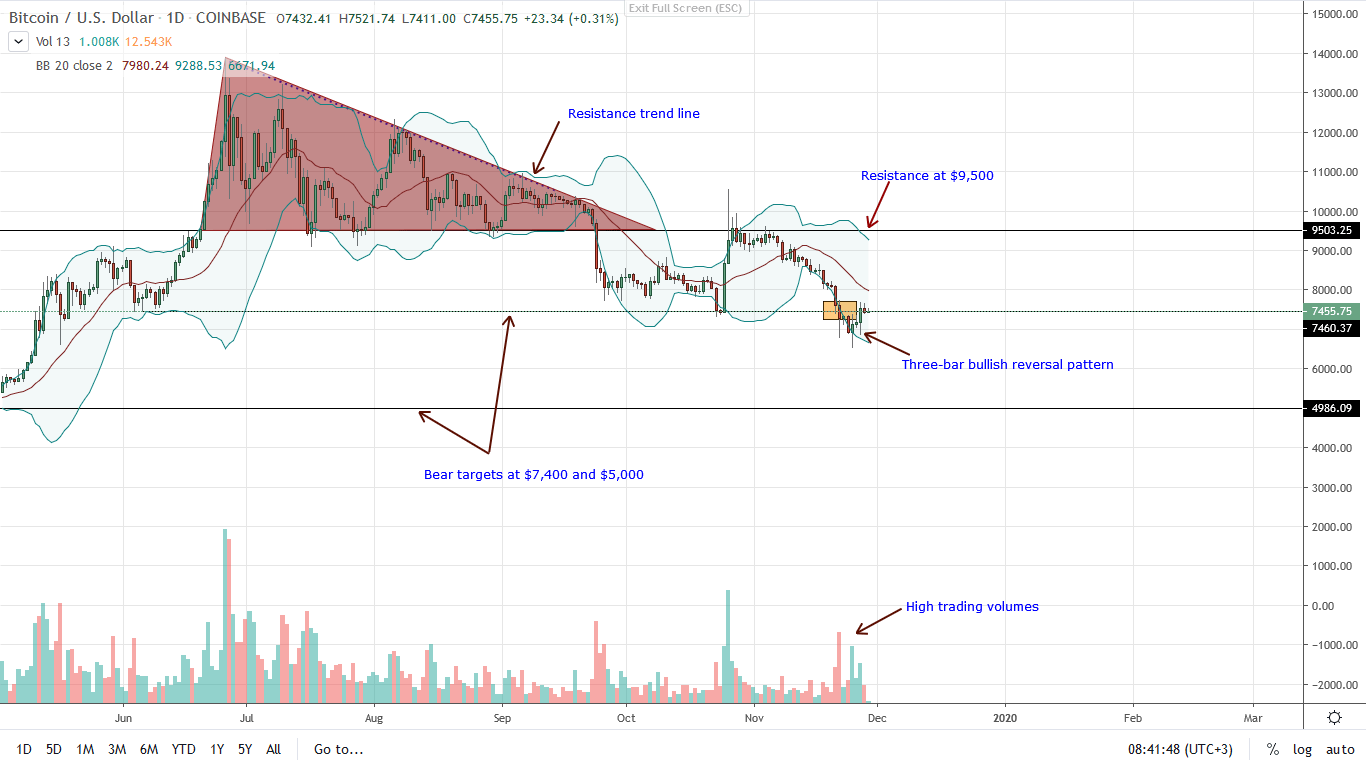
With a three-bar bullish reversal pattern and relative higher highs compared to last week’s lows, it’s a reprieve for buyers.
While it could be an opportunity for aggressive traders to buy the dips and aim for $8,500 and later $10,00, risk averse trader should be on the sidelines until a clear breakout bar prints reversing last week’s steep losses.
The result would be a double-bar bull reversal pattern clear in the weekly chart setting the ground for further upsides. For now, the divergence away from the lower BB following the drastic fall and undervaluation of BTC late last week could also be a pullback opportunity for sellers to enter shorts if bulls fail to reverse losses.
Any fall below $6,000 could see prices fall to $4,500 and later $3,000 as sellers press the liquidation pedal.
Chart courtesy of Trading View – Coinbase
Disclaimer: Views and opinions expressed are those of the author and is not investment advice. Trading of any form involves risk. Do your research.


