
Though BTC is down more than 80 percent from 2017 peaks, it’s still up 58 percent from 2017 lows and up 10X in the last two years according to Bitcoin Jesus, Roger Ver analysis. This is bullish statistics and could even be a foundation of a possible loss reversal in the coming days. After all, BTC seems to be finding floors at around $6,000 with yesterday’s rejection of lower lows a hint of bulls.
BTC Fundamentals
“There isn’t an opportunity for yet another 1,000-times growth in anything in the space anymore”: That’s it folks. That’s Vitalik Buterin deduction of the crypto verse of which Bitcoin spearheads.
Citing a transition from superficial awareness to “real world application aiding economic activity” it’s true that the period of rapid expansion as witnessed last year did thrust Bitcoin into the limelight but Vitalik is afraid that the time of abundance is over.
Indeed, judging from price action–and 95 percent declines from last year’s peaks, Bitcoin is indeed struggling against a wave of sellers. And even with these heavy declines, this is not the first time Bitcoin has demonstrated these levels of price volatility.
Back when Bitcoin tested $1,000, prices did decline testing $100 before bottoming out and accelerating to 2017 highs before collapsing to near $6,000 levels.
The only difference now is that there is a lot at stake and with institutional grade investors, industrial miners and a rigid development core, the last eight-month decline has been making headline news.
Still, there is the effect of Miners and in the last day, CNBC Fast Money contributors, fund founders and traders, Brian Stutland and Jim Luorio said $6,000 is an important level of Bitcoin from a mining point of view.
Bitcoin (BTC) Technical Analysis
Weekly Chart
 The weekly chart paints a clear picture of the last eight months bear trend and with the bear resistance trend line capping gains. As expected, prices are down and in the last week alone, Bitcoin is down 13 percent triggered mostly by Sep 5 losses.
That’s not all. Prices are still oscillating inside a wedge with strong bases at the $6,000 level. This mark hasn’t been broken in the last three months but considering that prices are now moving around the apex of this wedge, we expect a break out anytime soon.
Since bears are in charge as reflected by the overall sentiment, most are rooting for sellers to breach the $5,800 and $6,000 level, render mining unprofitable as sellers drive prices towards the $3,000 mark.
However, contrarians might kick in and instead we might see a breach above $7,000 with the Bitcoin market closing above $12,000 by the end of the year.
All this view is advised mostly by candlestick specific characteristic of last week. Notice that though the candlestick is a dark cloud cover, eroding gains of the last two weeks, it has a long lower wick indicating rejection of lower lows hinting of developing buy pressure.
It’s miniscule but it might be a founding for further loss reversal mainly because this support is stemming out from the all important $6,000 mark.
Daily Chart
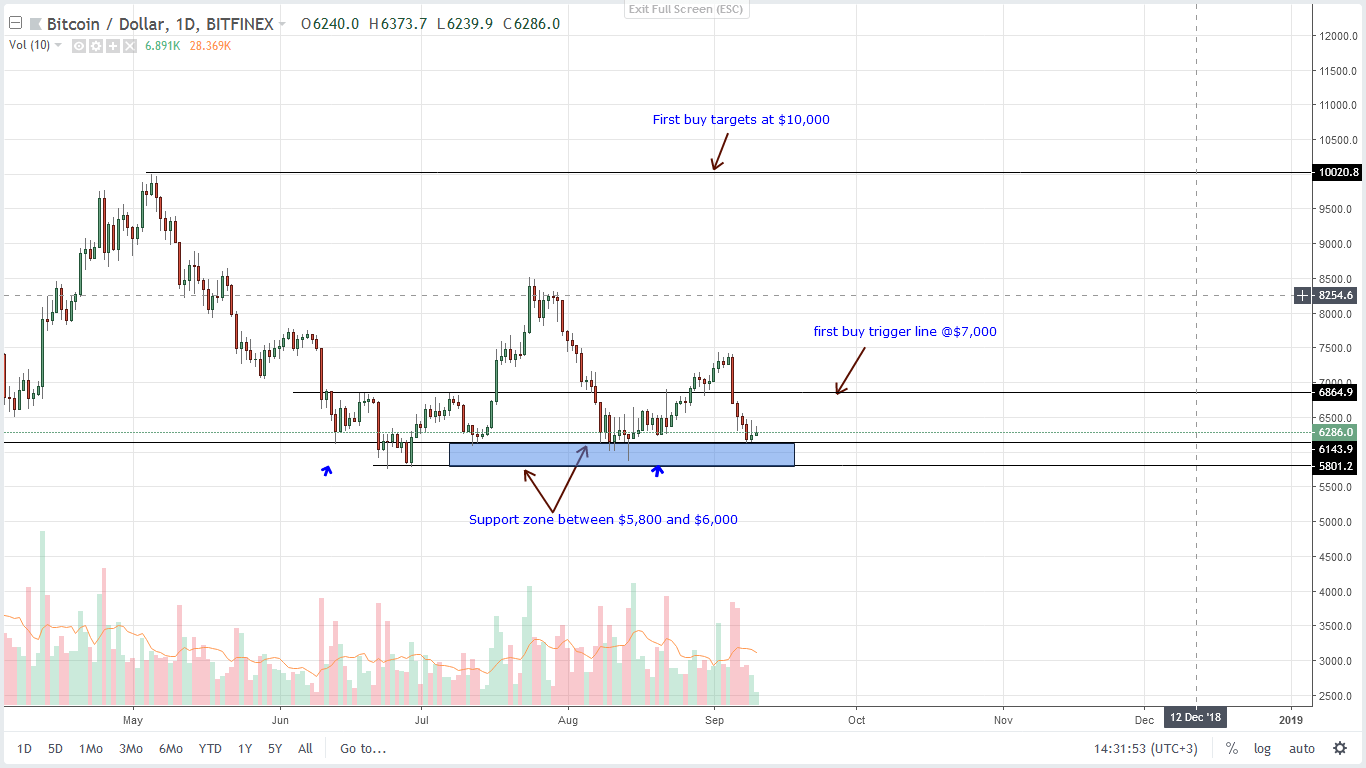 In six different occasions over a span of three months, Bitcoin has retested the $6,000 level and every time prices recover shortly after. So, going by historical happenings, we expect the same to happen after yesterday’s double bar reversal pattern stabilizing prices.
The thing is, should today end up higher confirming yesterday’s gains, then we suggest exiting Sep 5 sells and fading the market with small lots with first targets at $7,000. If not and today end up lower, then we sellers should move their stops to break even.
Disclaimer: Views and opinions expressed are those of the author and aren’t investment advice. Trading of any form involves risk and so do your due diligence before making a trading decision.