TLDR:
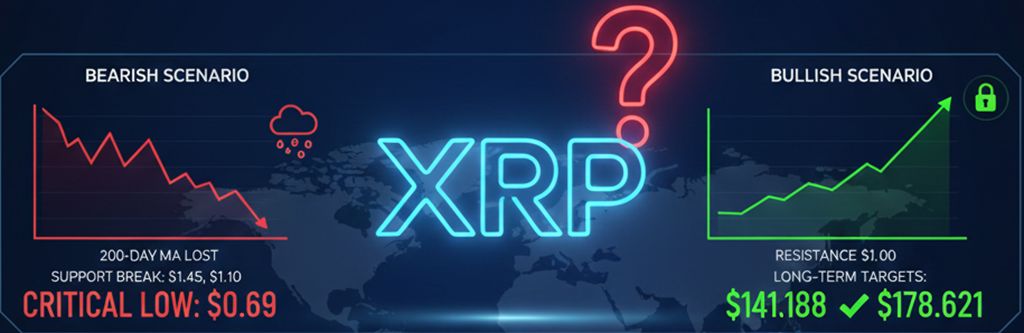
- XRP loses the 200-day moving average for the first time in over 400 days, signaling a trend shift.
- The asset faces strong psychological resistance at $2.00, consolidating within a narrow range.
- Ripple’s recent unlock of 1 billion tokens adds selling pressure to the market.
The latest XRP technical analysis reveals that the asset is at a critical inflection point after breaking a long-term support that held firm for over 400 days. This structural change occurs following a price close below the 200-day simple moving average, which has raised alarms among traders.
Currently, the price of XRP faces a psychological “wall” at $2.00. The lack of momentum to overcome this barrier has forced a consolidation in a narrow range between $1.85 and $1.88. For experts, this type of volatility compression is usually the prelude to a sharp move, whether it be a definitive bullish breakout or a capitulation to lower levels.
Critical Levels and Supply Pressure
The XRP technical analysis suggests that, due to the explosive rally in November 2024 (where the price jumped from $0.50 to $3.00), there is a vacuum of historical structure below current levels. This means that if support is not reclaimed quickly, the price could drop rapidly. Analysts like Umair Crypto have identified downside targets at $1.45, $1.10, and even $0.69 in the event of a confirmed collapse.
Added to this technical weakness is a fundamental factor: Ripple’s scheduled unlock of 1 billion XRP tokens. This supply injection adds an extra layer of selling pressure at a time when demand seems to be faltering.
Despite the bleak outlook, it is not all pessimism. Expert analyst Chad points out that XRP still remains above an old ceiling that now acts as a structural floor. As long as the asset manages to hold above the 0.786 logarithmic Fibonacci level, the long-term bullish scenario remains valid.
In summary, the XRP technical analysis will determine in the coming sessions whether this consolidation phase is just a breather before attacking $2.00 again or the beginning of a deep correction.