TL;DR
- Solana trades near a major ascending support level after a fresh pullback that places the token at a decisive technical junction.
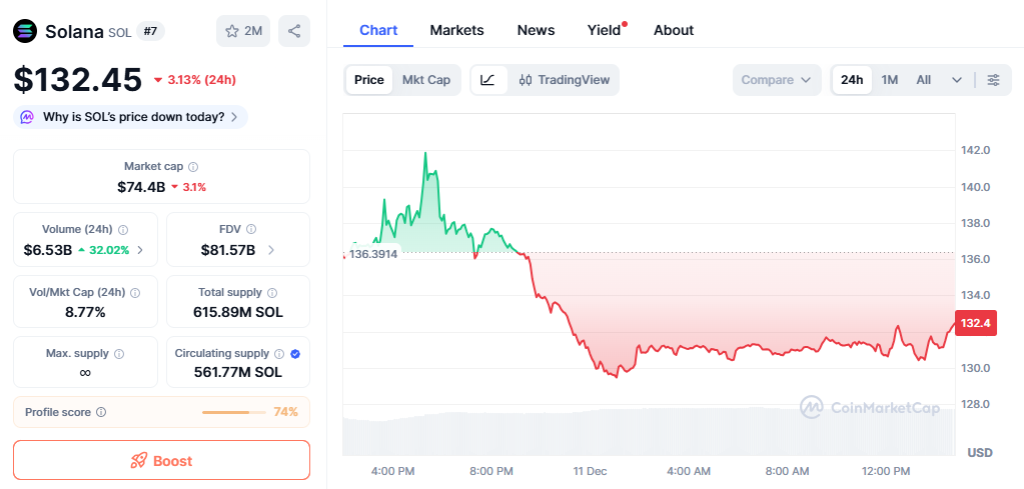
- SOL is priced at $132.45 with a 3.13% drop in the past 24 hours, while market cap stands near $74.4 billions.
- Price action shows compression against support, a pattern that often precedes large expansions.
Solana approaches a critical moment as price returns to a structural support area that has repeatedly attracted demand. The token trades around $132.45 after a 3.13% decline in the past twenty-four hours, while market capitalization remains close to $74.4 billions. Traders follow the current setup closely because chart behavior indicates tightening conditions typically linked to volatility phases.
Critical Support Dynamics In Focus
The recent rejection near $140 pushed SOL back into the mid-$130 region, where several rebounds took place during the past week. Trading activity increased during the pullback, showing that short-term sellers controlled the move, yet support continues to function. This area includes an ascending trendline that has guided price since early December and remains a key structural reference. Current oscillation around this trendline suggests that markets are assessing the next directional impulse.
Short-term charts show a sequence of lower highs forming since December 10 along with a break of minor structure that shifted momentum toward sellers. Even so, the $130–$133 zone overlaps with previous liquidity clusters often used by medium-term traders for evaluation. This keeps both paths open. A push above the latest intraday rejection zone could restore confidence among buyers, while a sustained breakdown of the ascending line may attract momentum traders positioned for continuation.
Pattern Structure And Market Implications
The setup includes a failed breakout earlier this week, when SOL briefly attempted to clear the upper diagonal and reversed. This weakened short-term bullish conviction but left the broader structure intact. Compression around the trendline hints at energy accumulation, a configuration often observed before directional expansions.
Analysts outline two potential outcomes. A constructive scenario requires a defense of the ascending support followed by a move toward the $136–$138 region. Such strength would signal renewed demand and reopen the path toward recent highs near $142. The alternative scenario emerges if price breaks below the trendline, exposing liquidity areas near $126–$128 as potential reaction zones.
Despite the corrective move, Solana’s medium-term structure remains stable. Network activity stays solid, daily volume on core applications continues to rise, and on-chain metrics show consistent user engagement. These elements provide a supportive backdrop for a pro-crypto perspective, highlighting resilience even during short-term retracements.