
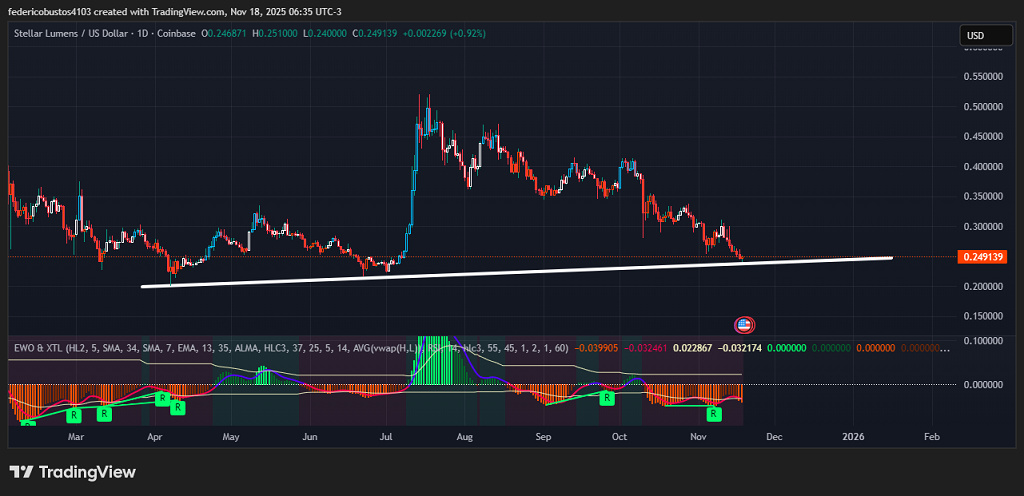
- Critical zone: XLM is trading at $0.2491 supported by a key upward trendline; its break or defense will determine whether the bearish cycle continues or a solid rebound begins.
- Mixed fundamentals: The Stellar ecosystem shows real progress in tokenization and remittances, but the recent drop reveals selling pressure and lower institutional flow.
- Decisive moment: Technical indicators do not confirm a reversal; price sits in a binary zone where patience is strategic.
Mixed Fundamental Impulse: Recent Selling Pressure and Advances in Real Adoption
XLM has experienced clear bearish pressure: it broke support at $0.28 with surging volume, suggesting accelerated selling, likely institutional profit-taking or temporary lack of interest. At the same time, the Stellar project continues advancing in its tokenization vision, with reports of expansion in real-world assets (RWA) and smart contracts, with applications in remittances, green financing, and solar debt, keeping its utility narrative active.
However, the global macro environment does not help: Bitcoin has dropped sharply to the $91,000 area, causing spillover into altcoins like XLM, especially in a market worried about new FED decisions. This combination of technical and macro pressure creates a dilemma: Stellar has an attractive real use case, but institutional flows may slow if macro uncertainty persists.
Technical Analysis of $XLM
The daily chart of XLM clearly shows that the price ($0.2491) is resting on a crucial dynamic support, an upward trendline confirmed since July, from which the asset has corrected about 52%. This support is now the boundary between a healthy technical rebound and the possibility of deepening the bearish phase.
Recent volume supports declines more than recovery attempts, revealing that sellers maintain control, although the intensity of bearish pressure has decreased over recent sessions. The EWO reflects this exhaustion: negative bars are beginning to shrink, showing weakening bearish momentum, but no clear shift toward positive momentum has appeared yet.
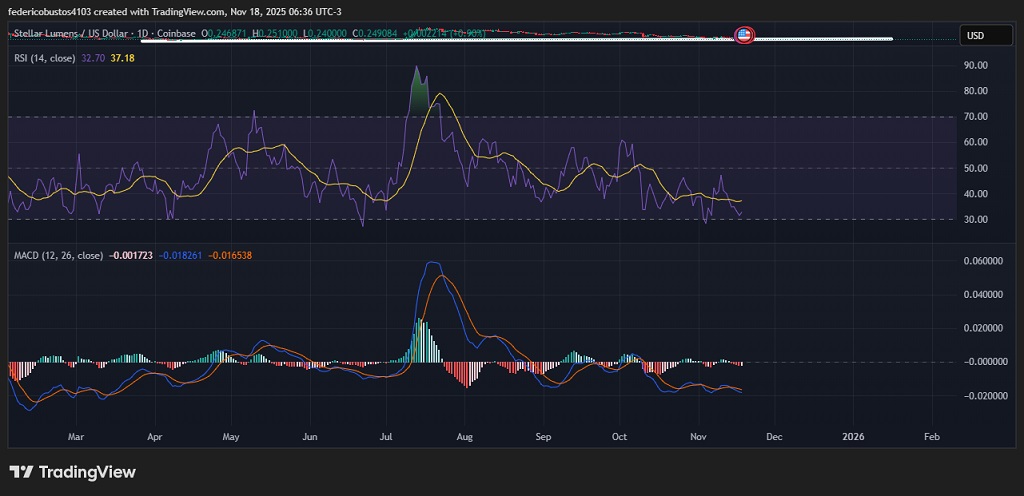
The RSI at 32, near low levels and approaching the oversold zone, suggests the asset may be technically positioned for a rebound, although the absence of strong bullish divergences indicates that a convincing reversal signal is still lacking. Meanwhile, the MACD remains negative and without a defined bullish crossover, confirming that the dominant trend remains downward.
Conclusion and Scenarios
Taken together, the indicators describe a scenario of weakness but also exhaustion of the downward movement. This leaves XLM in a binary situation: if the upward trendline again acts as solid support, price could begin a recovery toward higher areas; if instead a break with volume occurs, the technical structure would enable a new bearish phase. Therefore, the most prudent and professional reading is to wait for a decisive daily close before anticipating any trend change.
Technical charts courtesy of TradingView.
Disclaimer: The opinions expressed do not constitute investment advice. If you are looking to make a purchase or investment, we recommend that you always do your research.
If you found this article interesting, here you can find more STELLAR News.