
TL;DR
- BNB reached $943 on September 13 after a 57% rally that began in June, but since then it has shown signs of exhaustion.
- The fundamental backdrop remains positive thanks to growing demand and institutional interest, although bullish momentum has stalled.
- Technically, indicators suggest weakness: RSI at elevated levels, MACD losing strength, and EWO neutralizing, with a high probability of a correction toward $860–870.
Solid Fundamentals, but Signs of Short-Term Consolidation
BNB pulled back in recent sessions, raising doubts about the continuation of its rally. This retracement coincided with a temporary pause in some Binance contracts and the broader bearish pressure in the altcoin market, which could push it into a consolidation phase after nearly 57% gains in the prior two months.
On the fundamental side, BNB demand remains solid given its core role within the Binance ecosystem, particularly in trading fee discounts and participation in new token launches. In addition, a $100 million fund for DeFi projects on BNB Chain and the launch of Medá, a regulated fintech in Mexico integrating the ecosystem, reinforce the token’s practical utility. Expectations of a possible additional strategic burn also sustain long-term appetite, fueling projections that place BNB above $1,000 in the medium term. However, in the short term, many analysts lean toward a technical correction rather than further fundamental-driven momentum.
$BNB Technical Analysis
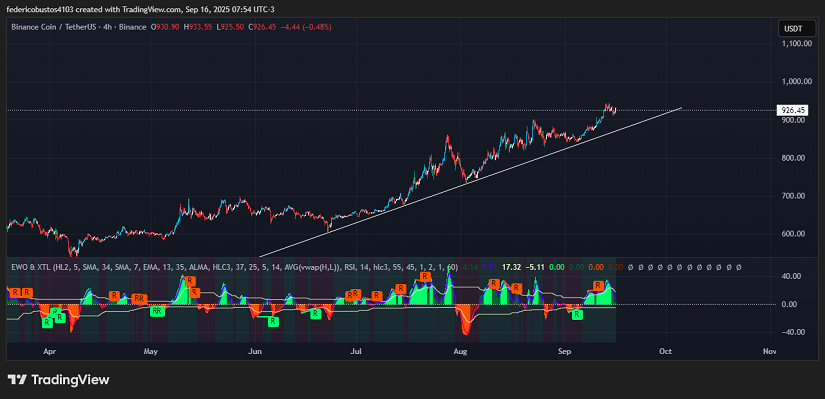
From a technical perspective, BNB shows an interesting structure on the 4H chart. Price climbed from $601 on June 22 to a local high of $943 on September 13 (+57%), but since then buying pressure has weakened. Its current price of $926, with only a mild pullback, confirms that the psychological resistance at $950 remains intact.
Volume dynamics support this view: after the sharp rally, buying pressure has eased, giving way to lighter order flow—typical of distribution phases. The EWO remains positive but with shrinking bars, signaling loss of momentum and a higher probability of a short-term bearish reversal.
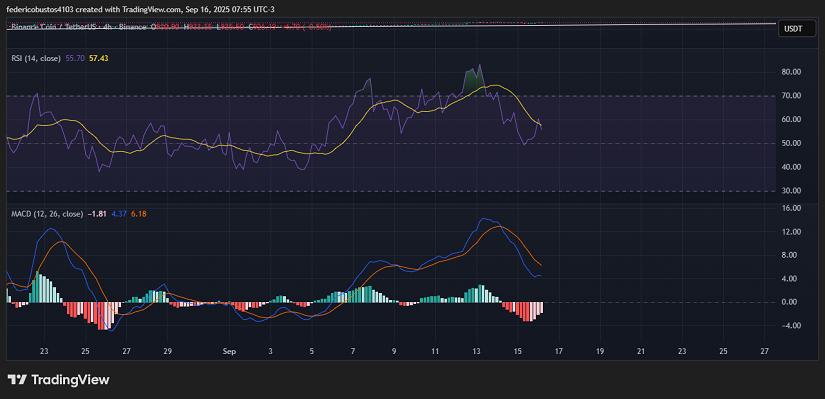
The RSI sits around 55, a relatively high level as it comes off prior overbought conditions. While no clear bearish divergences have formed, the downward slope suggests room to correct toward 45–50, even without oversold levels. Meanwhile, the MACD is losing strength: its histogram began contracting on September 14, a signal that usually predicts selling dominance.
Conclusion and Scenarios
The medium-term uptrend remains intact as long as the ascending trendline holds. However, the lack of momentum and weakening technical indicators point to a likely correction. The key support lies at $860–870, an area of prior liquidity and buying interest. If the trendline is respected, price could consolidate and attempt another move toward $950.
Technical charts courtesy of TradingView.
Disclaimer: The opinions expressed do not constitute investment advice.If you are looking to make a purchase or investment, we recommend that you always do your research.
If you found this article interesting, here you can find more BNB News.