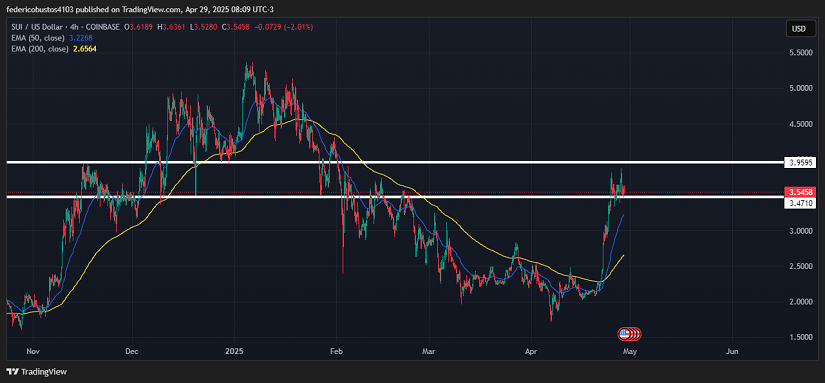
- After an impressive rebound of over 100% from April lows, $SUI is now entering a consolidation phase within a well-defined channel between $3.4710 and $3.9595.
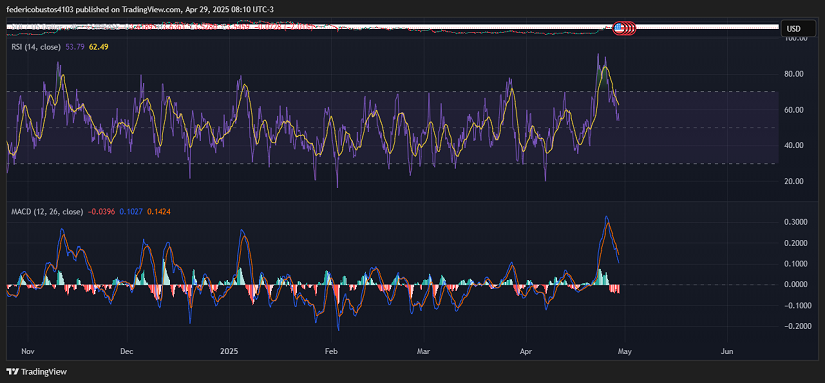
- Technical indicators such as the RSI and MACD suggest a short-term loss of bullish momentum following the strong surge that began on April 9.
- On May 1st, 74 million tokens will be unlocked, representing 2.28% of its circulating supply, which could generate downward pressure on the price.
Solid Growth in Sui Network Amid a Challenging Token Unlocking
Activity around the Sui Network has shown significant progress that could positively impact the demand for $SUI. Recently, there has been a noticeable increase in DeFi and NFT projects built on its blockchain, highlighting its scalability and efficiency. This growth in the ecosystem may lead to higher usage of the native token for transactions and governance. Furthermore, on-chain metrics reveal strong growth: TVL (Total Value Locked) rose by 40% in April, reaching $1.73 billion, while trading volume on its DEX surpassed $500 million, indicating increased activity.
However, this expansion is happening at a critical moment, as SUI is about to unlock approximately $262 million worth of tokens, 2.28% of its current circulating supply. Although investor confidence has grown thanks to strategic partnerships like those with xPortal and xMoney, and the launch of the Grayscale SUI Trust, which alone pushed the price up by 23% on April 25, the upcoming unlock of 74 million tokens on May 1st could exert downward price pressure.
Technical Analysis of $SUI
$SUI’s price action indicates a consolidation phase following a notable recovery. After bottoming out at $1.7158 on April 7, the price experienced a vigorous upward movement (+100%). The crossover of the short-term EMA (50) above the long-term EMA (200) definitively signals a trend reversal.
Currently, the price sits at $3.5458 and is fluctuating within a well-defined channel, with support at $3.4710 and resistance at $3.9595. Although volume supported the initial rally, it has declined during this sideways phase, suggesting a pause in strong buying pressure.
The Relative Strength Index (RSI) is currently around 54, after having reached overbought levels in recent sessions. This correction from the overbought zone indicates that the token may need a consolidation period.
As for the MACD, we see that the blue MACD line has crossed below the orange signal line, generating a bearish signal. The histogram also shows red bars, reinforcing the idea of a possible short-term correction or continued lateral movement.
Conclusion and Scenarios
The current sideways movement within the $3.4710–$3.9595 channel suggests a period of indecision in the market. For a significant bullish move to resume, a convincing breakout above resistance accompanied by an increase in volume would be crucial.
On the other hand, if selling pressure intensifies and the price breaks below the $3.47 support level with notable volume, we could expect a correction toward lower levels, potentially retesting the 50-period EMA as a dynamic support.
Technical charts courtesy of TradingView.
Disclaimer: The opinions expressed do not constitute investment advice. If you are looking to make a purchase or investment, we recommend that you always do your research.
If you found this article interesting, here you can find more ALTCOINS News.