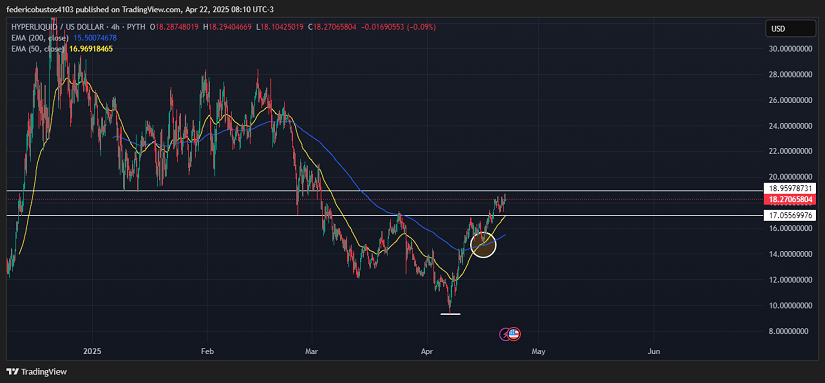
- $HYPE has risen 40% since early April. It is currently trading within a channel with support at $17.05 and resistance at $18.95, and has broken above the 50-period EMA, indicating a bullish bias.
- Speculation about a second phase of airdrops could increase participation in the Hyperliquid ecosystem and create upward pressure on the price.
- The price of $HYPE, currently at $18.27, shows bullish signals following the “golden cross” and rising volume, but it needs to break above $18.95 to confirm momentum toward the $21–$22 range.
Hyperliquid Leads with Strength and Fuels Expectations
Hyperliquid ($HYPE) has solidified its position as a leader in the on-chain perpetual futures market, capturing around 70% of the market share. This dominance is reflected in a trading volume that reached $83 billion in mid-April, demonstrating sustained growth and strong demand from both institutional and retail traders.
At the same time, anticipation is building around a potential second phase of airdrops. Although not officially confirmed, there is speculation that Hyperliquid may launch a new token distribution campaign, further incentivizing participation in its ecosystem.
In this context, $HYPE has stood out with performance well above the market average, recording an approximate 40% increase since early April.
Technical Analysis of $HYPE
Price action on the 4-hour timeframe reveals a market structure beginning to lean towards a bullish bias.
We can observe that the current price of $18.27 has broken above the 50-period EMA (yellow line), which historically may indicate a short-term trend reversal to the upside. Even more significant was the crossover between the 50 and 200 EMAs on April 15, forming a “golden cross.”
Currently, the price is consolidating within a channel with support at $17.05 and resistance at $18.95. Volume has shown an increase during recent bullish candles, lending more credibility to the recovery move.
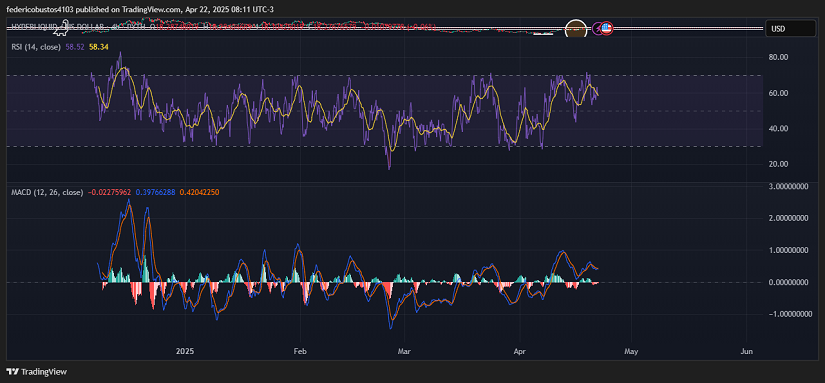
The Relative Strength Index (RSI) is currently around 58.52, trending upward but not yet in overbought territory (typically above 70). The ongoing movement between the 60 and 70 range can be interpreted as a consolidation phase with a positive trend.
At the bottom of the chart, we see the MACD indicator, where the orange signal line is above the blue MACD line, confirming a bearish crossover. The histogram displays red bars, indicating a loss of bullish momentum. However, as long as the MACD line remains above zero, the overall trend remains positive.
Conclusion and Scenarios
A decisive breakout above the channel’s ceiling at $18.95 with strong volume would be an important confirmation of a potential target around the $21–$22 range.
However, if the price fails to break this resistance or if volume weakens, we could expect a consolidation period or even a pullback toward the 50-period EMA again.
Technical charts courtesy of TradingView.
Disclaimer: The opinions expressed do not constitute investment advice. If you are looking to make a purchase or investment, we recommend that you always do your research.
If you found this article interesting, here you can find more ALTCOINS News.