- $HBAR is currently trading at $0.16539, showing an interesting 5.21% recovery over the past week.
- The recent integration of Hedera with Nvidia and Chainlink has sparked increased demand, reflected in a rise in long positions.
- Despite positive signals, technical risks persist, including a potential deepening of the “Death Cross” (200 and 50 EMA crossover) that began in February of this year.
Demand Surge Despite Economic Context
In recent weeks, Hedera has caught the market’s attention due to its integration with Nvidia for artificial intelligence applications and its partnership with Chainlink to improve interoperability in DeFi. These partnerships have driven increased demand for $HBAR, evidenced by a 5.21% price increase over the past week and heightened activity in long positions.
However, the macroeconomic environment poses challenges. The crypto market recently lost $50 billion in value, and the Fear and Greed Index stands at 31, indicating a trend toward fear. Despite these conditions, $HBAR’s resilience suggests a positive investor perception, although caution remains advisable, particularly for short-term traders.
Technical Analysis of $HBAR
From a technical standpoint, the $HBAR H4 chart shows mixed signals.
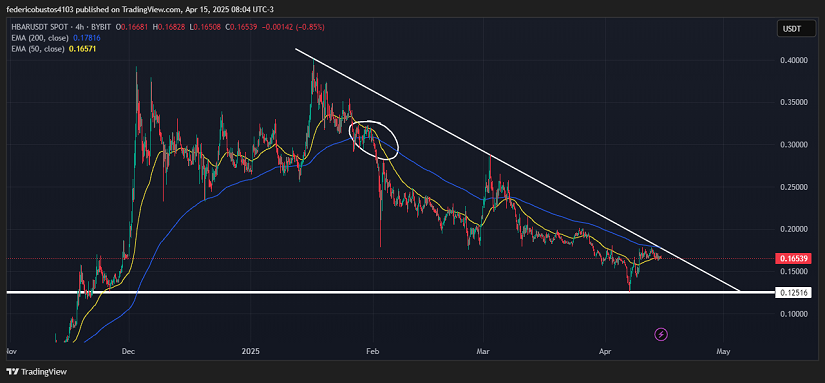
The market value of the Hedera Hashgraph token stands at $0.16539, recording a 2.5% decline in the last 24 hours. The chart shows that after testing the key support at $0.12516 on April 7, it began to rebound.
However, trading volume has remained relatively low, which could indicate a lack of conviction in the movement. The 50- and 200-day moving averages are slowly converging, though it’s still too early to call a reversal of the bearish “Death Cross” that began last February.
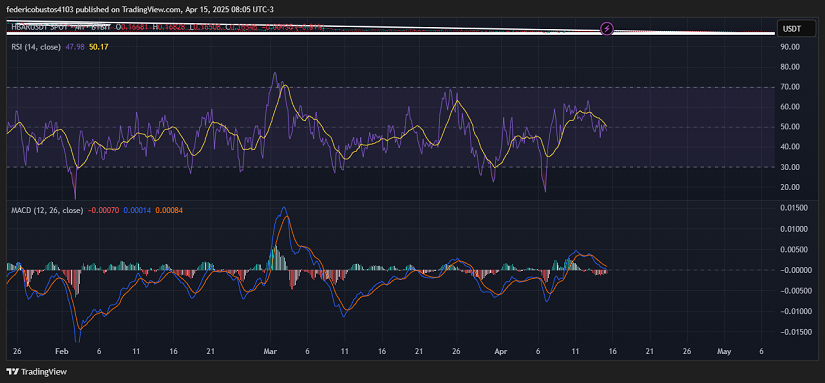
On the 4H timeframe, we also see the RSI (14) hovering around the neutral level of 47.98, indicating sideways momentum and a lack of sustained buying or selling pressure. The MACD (12,26) confirms this indecision: its lines are near the zero axis, reflecting weak trend direction and low volatility. No significant divergences are observed in either the RSI or the MACD histogram, reinforcing the idea of a consolidation phase. This behavior suggests a possible accumulation period, with price compression potentially preceding a more defined directional move in the coming sessions.
Conclusion and Scenarios
Although Hedera’s strategic partnerships provide solid long-term fundamentals, current technical indicators suggest caution.
A breakout above the 200 EMA with rising volume could confirm a bullish trend. Conversely, failure to hold key levels may lead to a rejection at the descending trendline and a return to the $0.12516 support.
It’s recommended to closely monitor global market movements and upcoming news related to Hedera’s strategic partners, as these could act as catalysts for a more defined trend in $HBAR’s price.
Technical charts courtesy of TradingView.
Disclaimer: The opinions expressed do not constitute investment advice. If you are looking to make a purchase or investment, we recommend that you always do your research.
If you found this article interesting, here you can find more ALTCOINS News.