
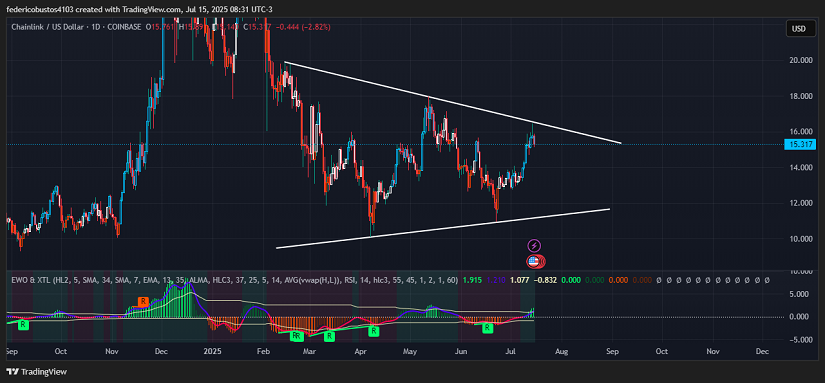
- Chainlink has been forming a descending triangle over the past few months and is approaching a potential breakout, although it has recently shown signs of exhaustion in its bullish momentum.
- LINK is trading at $15.317 after a 40% correction from $18 in May, touching $10.90 in June. Bitcoin’s recent all-time high has renewed institutional interest.
- Analysis of indicators such as RSI, EWO, and MACD suggests possible sideways movement in the short term, with no clear upward breakout yet.
Strategic Strengthening and Optimistic Outlook for Chainlink in the Blockchain Ecosystem
Chainlink has strengthened its position in the blockchain ecosystem through strategic partnerships with renowned financial institutions. One of these collaborations is with Mastercard, which will enable over 3 billion cardholders to purchase cryptocurrencies directly on-chain using Chainlink’s infrastructure.
On the technological front, Chainlink has launched the Automated Compliance Engine (ACE) in collaboration with Apex Group and GLEIF. This tool allows the creation of reusable digital identities and the automated execution of compliance policies, facilitating the integration of tokenized assets into DeFi platforms and traditional financial markets.
Additionally, the designation of the week of July 14–20 as “Crypto Week” in the U.S. has created an optimistic atmosphere in the sector. During this week, key votes will take place on bills such as the CLARITY Act and the GENIUS Act, which aim to establish a clear regulatory framework for cryptocurrencies.
Bitcoin’s recent surge to a new all-time high has also renewed institutional interest in altcoins.
LINK Technical Analysis
From a technical perspective, Chainlink’s (LINK) chart shows a significant correction after reaching a notable peak of $18 on May 12. The price dropped to $10.90 at the end of June, then rebounded to its current level of $15.317 (-2.82% in the last 24 hours). However, the lack of strength to achieve a breakout suggests the price will likely continue moving sideways in the short term.
The EWO (Elliott Wave Oscillator) does not yet show signs of exhaustion in bullish momentum. In fact, the histograms are beginning to break out of the squeeze band.
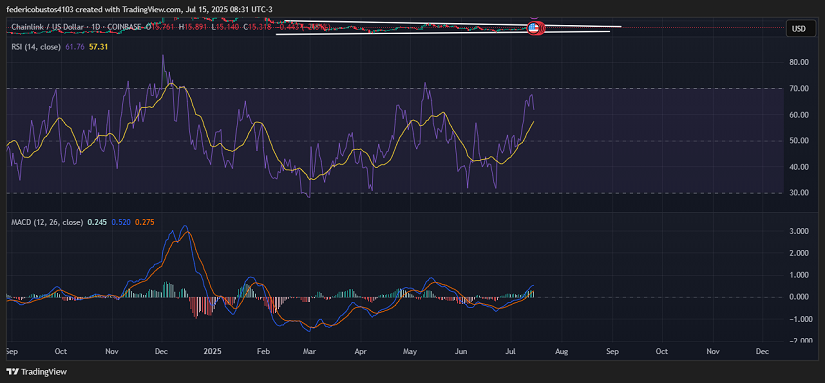
However, the RSI is around 61, indicating that the market is close to entering overbought territory, which could lead to a short-term correction or a pullback in the trend.
The MACD showed a bullish crossover last month, but there is still no solid confirmation of a trend reversal, as its histogram remains low and the momentum indicators do not yet point to an immediate rebound.
Conclusion and Scenarios
Despite being close to a potential medium-term bullish breakout, the current price action and indicators point to a phase of consolidation or sideways movement. The price could continue fluctuating between $14 and $16 before a definitive breakout in either direction.
Technical charts courtesy of TradingView.
Disclaimer: The opinions expressed do not constitute investment advice. If you are looking to make a purchase or investment, we recommend that you always do your research.
If you found this article interesting, here you can find more CHAINLINK News.