Until November 6, Solana prices added 27 percent in two days, breaking above key resistance levels as prices soared higher, aligning with the broader market performance.
At spot rates, Solana buyers are still upbeat; at this pace, there could be more gains in the short term. A clear development in the daily chart is that participation is above average, if not decent, and bars are wide-ranging, pointing to possible activity.
Therefore, as long as prices remain within a bullish formation and trending above immediate resistance levels at around $30, traders can look for entries on dips, targeting September and August 2022 highs.
Solana and Google Cloud
The pump of SOL prices is primarily because of Google Cloud announcing their operation of a validator node. In that case, Google, known for supporting blockchain networks with notable partnerships with EOSIO and Ethereum, will be one of the platform’s validators.
This means that Solana’s reliability, considering the upsets in the past few months, could be more stable and, thus, draw more NFT, metaverse, and DeFi, activities. As part of this deal, Google Cloud will also index Solana data and add them to BitQuery. What this means is that Solana developers would, at any time, access historical data, easing the operation of their protocols.
This announcement is especially notable because Solana is undergoing a system and infrastructural overhaul overseen by Jump Capital. Eventually, Solana, currently in Beta, will shift and operate as a wholesome mainnet, incorporating all the lessons learned during the trial phase.
Solana Price Analysis
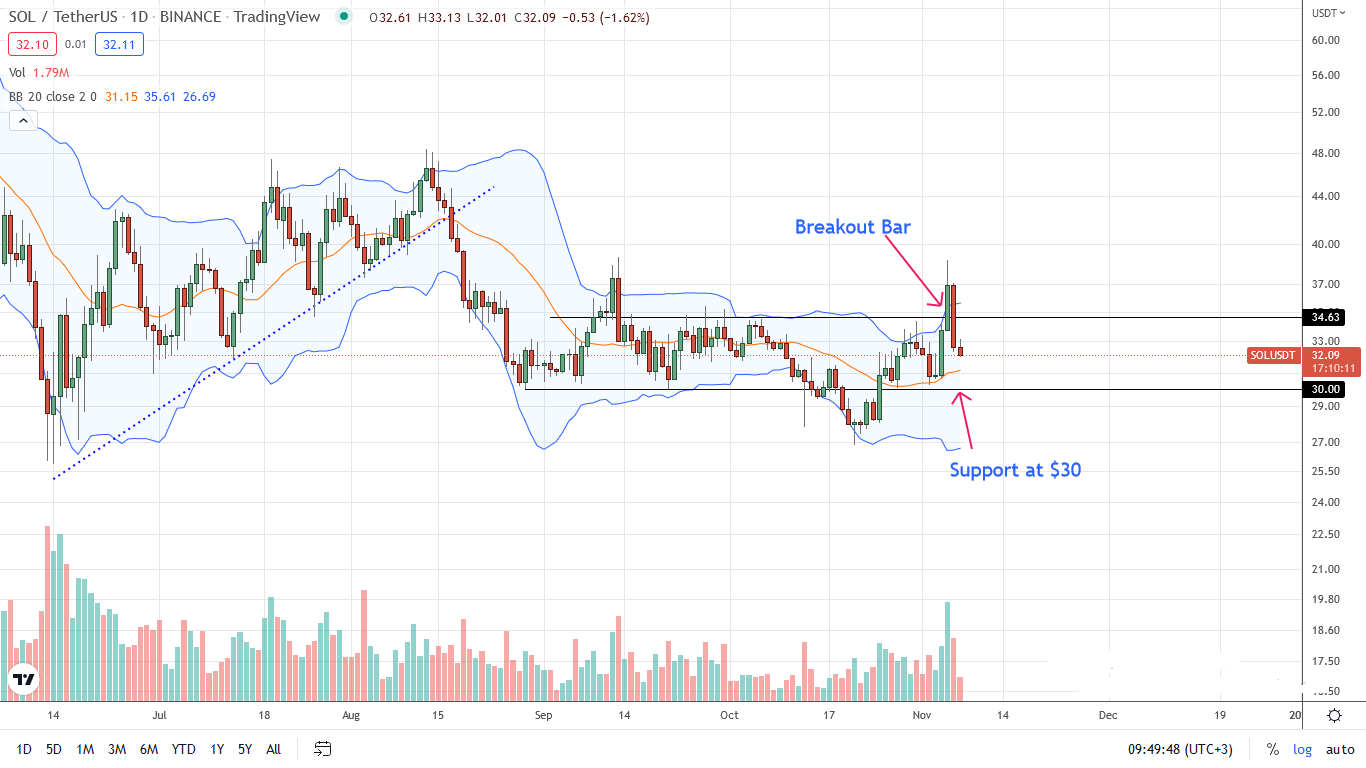
From the daily chart, SOL is within a bullish breakout formation. The coin is down on the last trading day but up in the last three days, surging nearly 27 percent.
Because the November 4 and 5 bull bars have high trading volumes and wide-ranging therefore defining the current trend, aggressive traders can look to buy on dips.
From a volume analysis perspective, this preview is valid as long as prices are within the November 4 and 5 bars.
Additionally, because losses of November 6 are with lower trading volumes, traders can buy the dips, targeting last week’s highs at around $40 and later August 2022 highs at approximately $50; confident from an effort versus result perspective.
Losses below $30 and November 4 lows will nullify this preview.
Technical charts courtesy of Trading View.
Disclaimer: Opinions expressed are not investment advice. Do your research.
If you found this article interesting, here you can find more Solana news