


Ethereum, looking at the performance in the daily chart, can’t shake off determined bears. There were initial hints of strength earlier this week, but those were quickly reversed on October 18.
Presently, there is a humongous bear engulfing bar with decent trading volumes forcing ETH back towards Q3 2022 lows. Notably, the reversal if from around critical resistance levels traders anticipated a reaction.
The failure of buyers to push through and crack $1.4k questions the strength of the uptrend and, overly, whether buyers have what it takes to change the short and medium-term trend of the coin. As it is, sellers are back in control, and ETH traders could be in for another rough ride in Q4 2022.
The Merge’s Significance and Ripple’s Plans to Connect to Ethereum
Apart from price action, ETH buyers are optimistic about the long term. The merge is a welcomed move and initiates subsequent changes that make ETH scarce and, thus, valuable. However, before utopia, traders must contend with a rough patch and even the dreaded possibility of plunging below $1.25k toward the $1k psychological support.
Dominant news is around Ripple announcing their plans to be interoperable with Ethereum. Through an Ethereum-compatible sidechain on the public XRPL, it would be possible for developers to enjoy the scalability of the smart contracts-enabled sidechain as soon as early 2023. Also, developers would transfer XRP and other compatible assets between the sidechain and the XRP Ledger Developer network, empowering users.
Ethereum Price Analysis
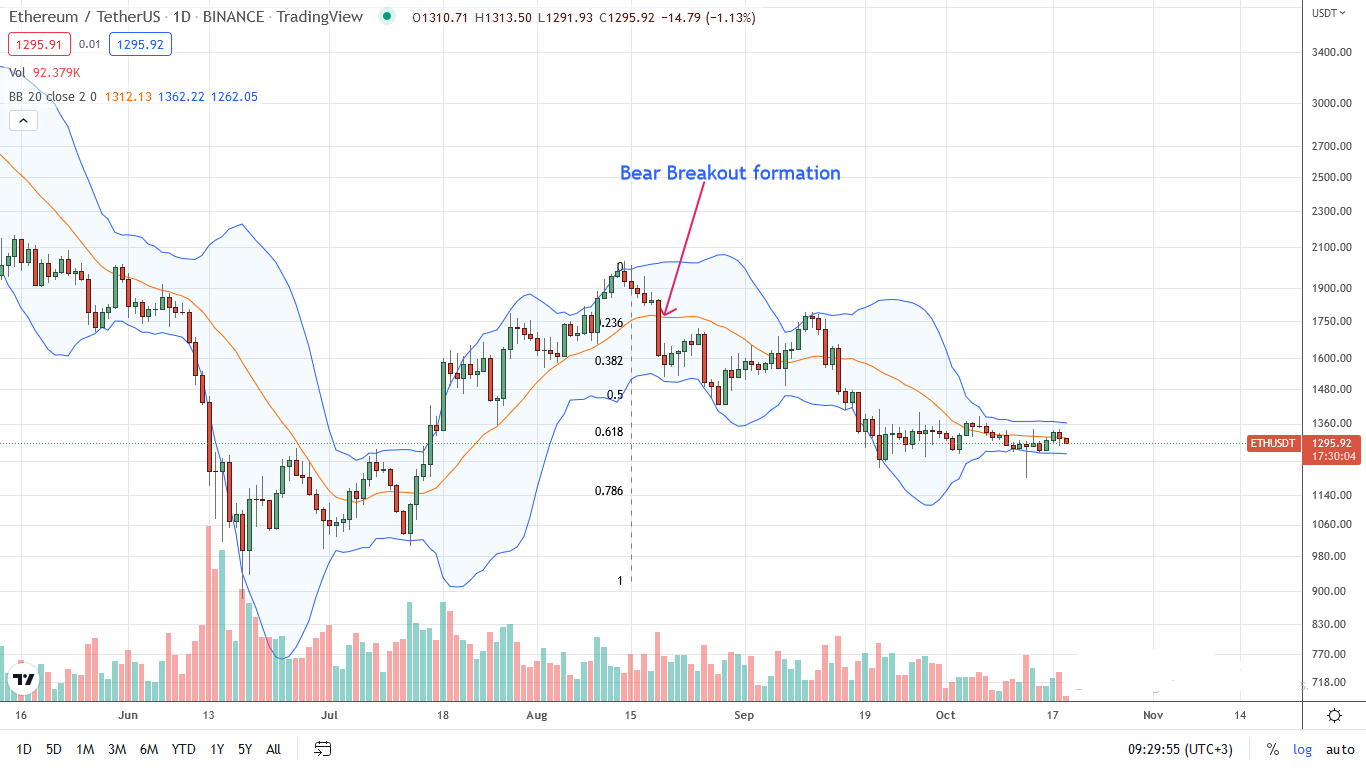
At press time, ETH is down two percent on the last trading day, reversing from this week’s highs at around $1.34k. Even though there were flashes of strength, ETH prices are consolidating. There are caps at $1.4k on the upper end and support at $1.25k.
As long as prices are inside this trading range, bears are in control. Therefore, for every attempt higher but below $1.4k, aggressive traders can liquidate with targets at the lower range of $1.25k. Thus far, the reversal from this week’s high and the October 18 bar closing as a wide-ranging bear candlestick signals weak buyers and possibly bear trend reversal.
On the other hand, conservative traders can wait for a clean break in either direction. A relieving rally above $1.4k may lift ETH towards $1.8k and, ideally, $2k in a welcomed buy trend continuation formation. If that happens, the 78.6 percent Fibonacci level, or $1.25k, coinciding with the September 2022 lows, will be a defining support level.
Technical charts courtesy of Trading View
Disclaimer: Opinions expressed are not investment advice. Do your research.
If you found this article interesting, here you can find more Ethereum News.


