Latest Ethereum [ETH] News
Of late, Ether, the native currency of the Ethereum blockchain has been outperforming their peers. Posting impressive records over the last few weeks and eventually reclaiming its rightful spot from XRP, observers as well as analysts pointed to ETHDenver as a possible cause of this expansion. But even if that was the case, we cannot discount a couple of technical and fundamental factors that are supportive of ETH prices.
Top of the list is favorable candlestick arrangement and added to the expectation of a software upgrade that is above all expected to be successful, the path of least resistance appear to be set. In the long run, Constantinople—the second stage of the Metropolis, is expected to turn heads and pump prices as Ethereum inch closer to Serenity where it is said the platform would scale by billions while simultaneously conserving energy.
Even so, it is adoption and eventual tokenization of assets—anchored on formulation and passing of supportive legislation—that will spur participation, driving volumes and prices towards late 2017 levels. Steps are being made and Nasdaq has integrated Brave Coin’s Ethereum and Bitcoin indices availing in real time data to firms using the mercantile’s Global Index Data Service (GIDS).
ETH/USD Price Analysis

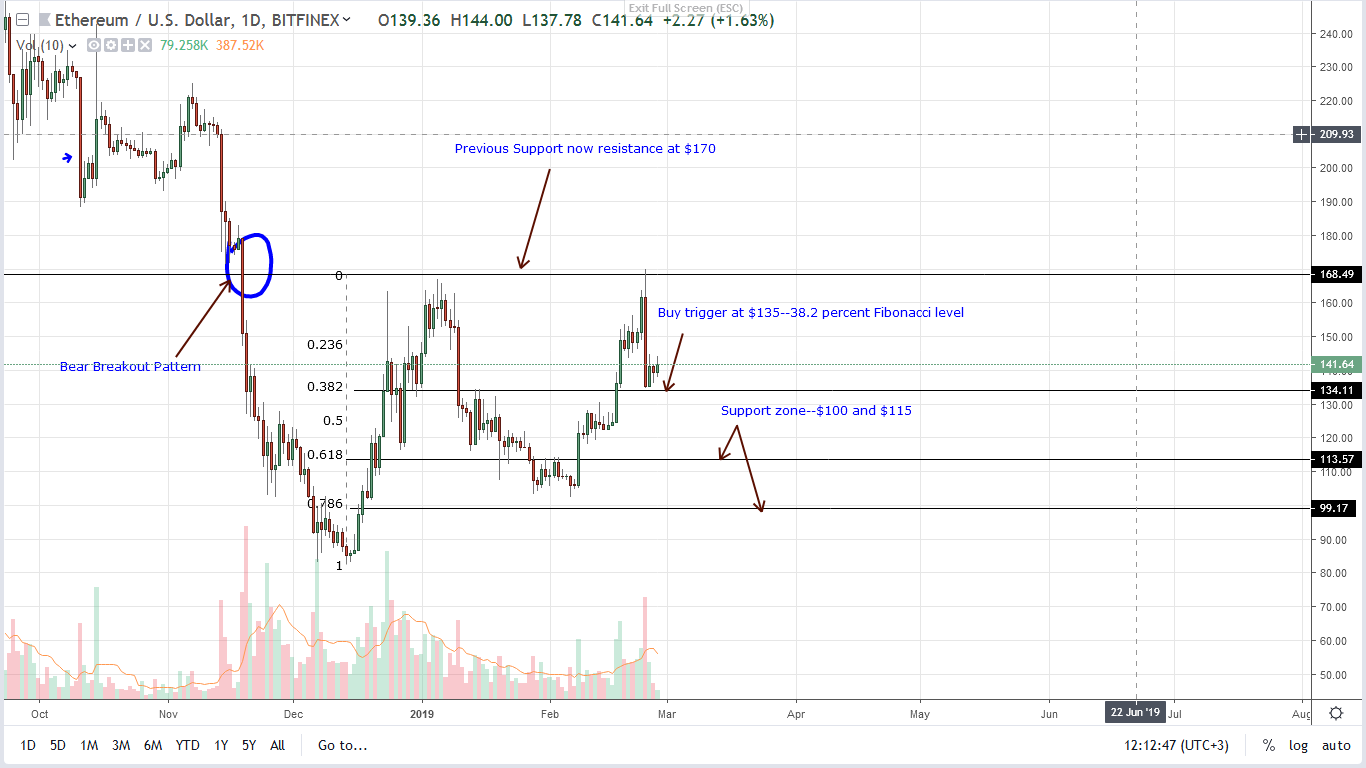
Although risk off buyers are in control, all we need—for trend continuation, is a break above $170 complete with high volumes. Such a move will invalidate the bear breakout pattern of mid-Nov 2018—note that $170 is previous support now resistance—allowing buyers to build momentum and snap back to $250 and even $320.
If not and sellers drive prices below $135—and they can—then we shall have a classic retest and the drop to $135 or $100 could possible lead to further losses as the third phase of a bear breakout pattern kick in breaking buyers.
All Charts Courtesy of TradingView—BitFinex
Disclaimer: Views and opinions expressed are those of the author and aren’t investment advice. Trading of any form involves risk and so do your due diligence before making a trading decision.


