
Less than two weeks before end year, the crypto market is bleeding and deep in red. Although the first year of the year was marked by a spectacular revival following last year’s collapse, the drub performances in the last several months paint a picture of fear and uncertainty.
And fear it was following Dec 16’s 10% ETH dump. Unexpectedly heaping more pressure on ETH and the below par performance of the network prices despite the encouraging preparation for Ethereum 2.0 that commentators doubt will be actualized on time and the network adopt Proof of Stake and Sharding by 2023.
Crypto dumping Related to PlusToken Coin Sales
The dump witnessed on Monday has been confirmed to be linked to previous reports that PlusToken were dumping Ethereum [ETH] tokens on the market.
According to findings by Chainalysis, the market should fasten their belts and expect more price bumps ahead.
Add that to the low liquidity as the market lull continues ahead of Christmas, a wholesale dump could literally break the market and that could fast track further losses that may see ETH drop to $100, or worse.
CoinFloor Delists Ethereum (ETH) and Bitcoin Cash (BCH)
Meanwhile CoinFloor is delisting ETH and instead focusing their effort on Bitcoin (BTC). CoinFloor is one UK’s longest serving cryptocurrency exchange and aside from ETH, the exchange will also delist Bitcoin Cash (BCH).
Citing an uncertain future of hard forks that the exchange says Ethereum 2.0 “could take years to complete” and as the network transits from Ethereum 1 to 2, there will be a period when there will be two versions of Ethereum running. That introduces further complexities now that it has been revealed that Ethereum could hard fork in Jan 2020 to fix Difficulty Adjustment.
ETH/USD Price Analysis
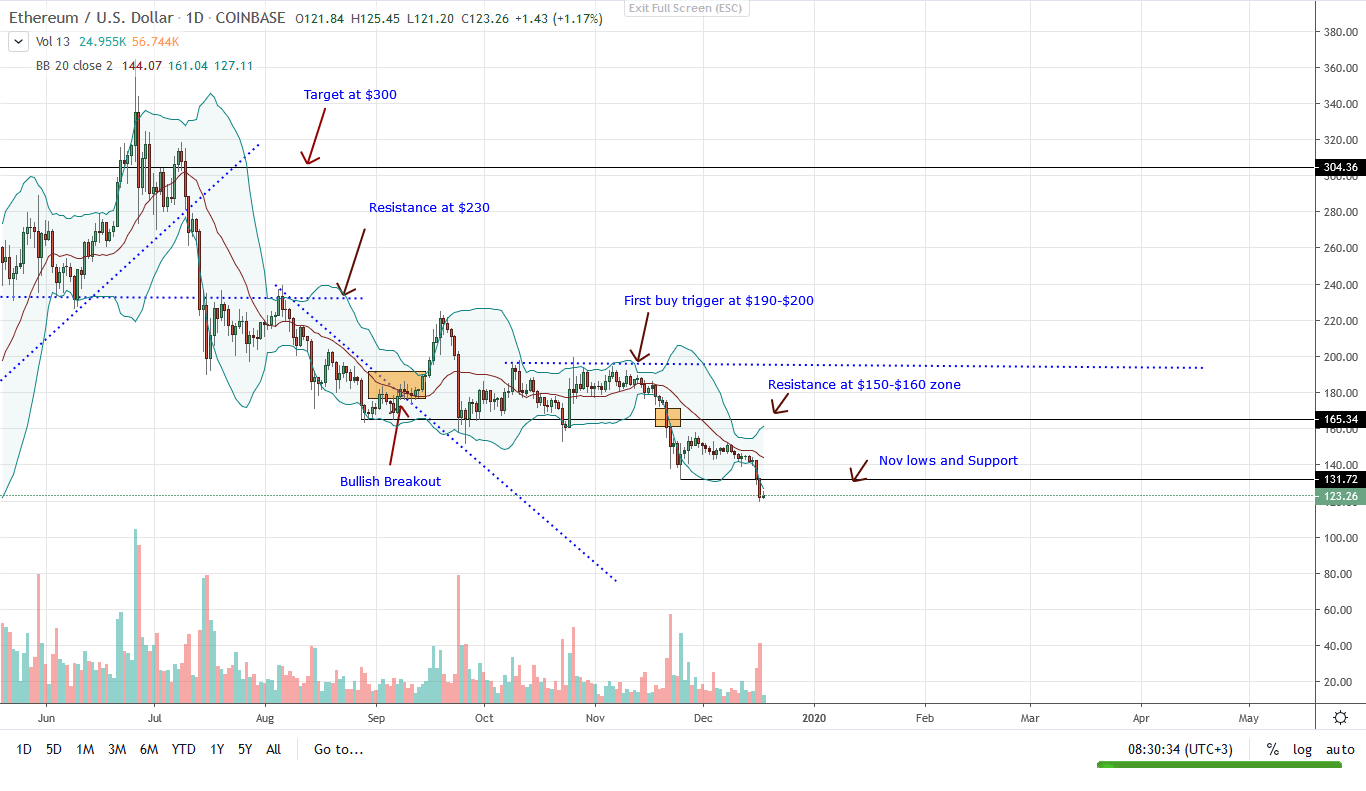
ETH is treading below Nov 2019 lows and is down 9.5% in the last day and 13% in the past week. Painting red, bears are in control.
Candlestick arrangement relative to the lower Bollinger Band (BB) suggests that prices will continue to fall in days head.
On Nov 21, ETH price fell below H1 2019 lows. Accompanying the bear breakout was an uptick in bear trading volumes because prices didn’t rise, but fall.
The failure of bulls to build on the brief recovery from Nov 24-28 means traders should watch how prices react at the middle Bollinger Band (BB), a flexible resistance line.
Also, the failure of ETH bulls to breach and close above $150-$160 resistance line means that ETH prices are in the third stage of a typical bear breakout pattern, the trend continuation phase.
At this pace, ETH price could sink to lows of $120 and worse $75 as per Fibonacci Extension levels based on H1 2019 trade range.
Chart courtesy of Trading View – Coinbase
Disclaimer: Views and opinions expressed are those of the author and is not investment advice. Trading of any form involves risk. Do your research.