
Ethereum prices are down three percent in the last trading day and under pressure, looking at the dismal performance in the daily chart.
Even though there were glimpses of strength, the failure of buyers to prevent further liquidation, especially in lower time-frames, is a concern.
As it is, traders can search for entries to buy, considering the coin remains in a bearish breakout formation.
With ETH tethering close to primary support, the odds of a dip below this line have been amplified following yesterday’s events.
Notably, from the daily chart, today’s bar might edge lower and band with the lower BB to signal increased selling pressure, a net negative.
Dominance as More ETH Burnt In the Last Winter
ETH remains under pressure despite solid fundamentals. DeFi and NFT activities might have fallen last year, but Ethereum remains a choice network.
There is a further endorsement from the platform opting for a staking system over a proof-of-work consensus algorithm with plans to scale the mainnet in the coming months.
I’m no ETH maxi, but over a 3-year time horizon, I can’t think of any better asset to own in the entire world than ETH.
— Qiao Wang (👽, 👽) (@QwQiao) March 2, 2023
The burn rate amidst this bear market has wildly exceeded my expectations.
As Ethereum dominates, an observer notes that the ETH burn rate exceeded expectations during the last bear cycle. Following the activation of EIP-1559, the network burns the “base fee” in a system where a user can “tip” the validator to prioritize their transaction.
This overhaul is overly positive and makes ETH more deflationary. Even though activity fell last year, more coins were destroyed. At this pace, ETH stands to become a deflationary coin, a choice for users searching for a store of value beyond Bitcoin and Gold.
Ethereum Price Analysis
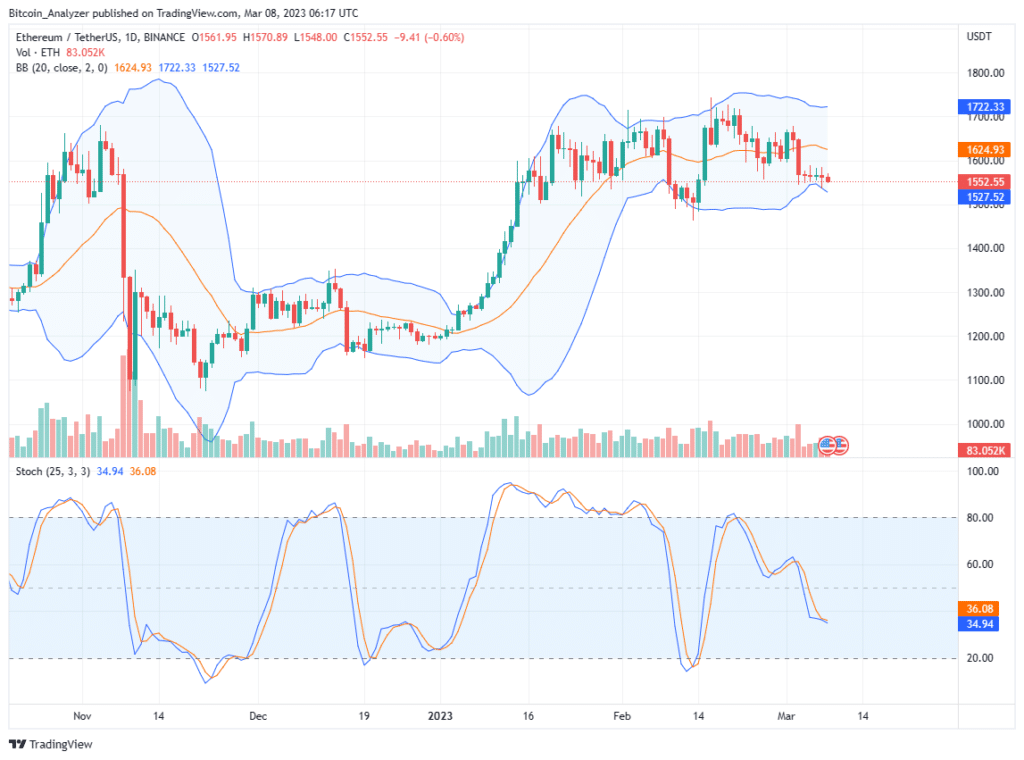
After encouraging gains from mid-December, the coin appears to be cooling off.
It remains within a broader bull flag with clear support at around $1.48k.
As it is, following losses below $1.58k on March 3, bears are in control. This preview is valid because bulls have failed to reverse losses, pushing prices above the bearish engulfing bar, possibly invalidating the bear breakout.
Instead, from the daily chart, prices are inching lower.
Based on this, traders may search entries to sell on every attempt higher, with targets at $1.48k in the short term.
Technical charts courtesy of Trading View Disclaimer: Opinions expressed are not investment advice. Do your research.