
Ethereum hasn’t been spared the sell-off, reading from the performance in the daily chart. Overall, the path of least resistance is defined and is southwards.
The liquidation on the tail end of last week means ETH, like most crypto assets, is down double digits from the August 2022 peaks.
Currently, the coin is down 18 percent from recent highs, shrinking three percent on the last trading day, and generally in consolidation.
Based on the candlestick arrangement in the daily chart, traders should look to liquidate. This preview, extrapolated from the ETHUSDT price formation, is because prices are still within the August 19 bearish engulfing bar.
ETH Shrinks ahead of the Merge
The development comes amid a blend of fundamental and project-related news. Of note, Ethereum is preparing for the merge that’s scheduled for mid-September.
The event will see Ethereum shift to a staking platform, away from the proof of work consensus system, which environmentalists insist is unsustainable and rewinds efforts to slow down climate change.
Besides conservation, Ethereum developers will be setting the base for better scalability down the line. Although the merge is the first of a series of upgrades that will see Ethereum process over 100k transactions per second, it will be a critical step in the network cementing its role in DeFi, NFTs, and other sub-sectors as a whole.
Meanwhile, Vitalik Buterin has lauded Canadians for pushing back attempts by two exchanges, Newton and Bitbuy, to cap annual spending on cryptocurrencies. The two had restricted crypto expenditure to CAD$30k.
Ethereum Price Analysis
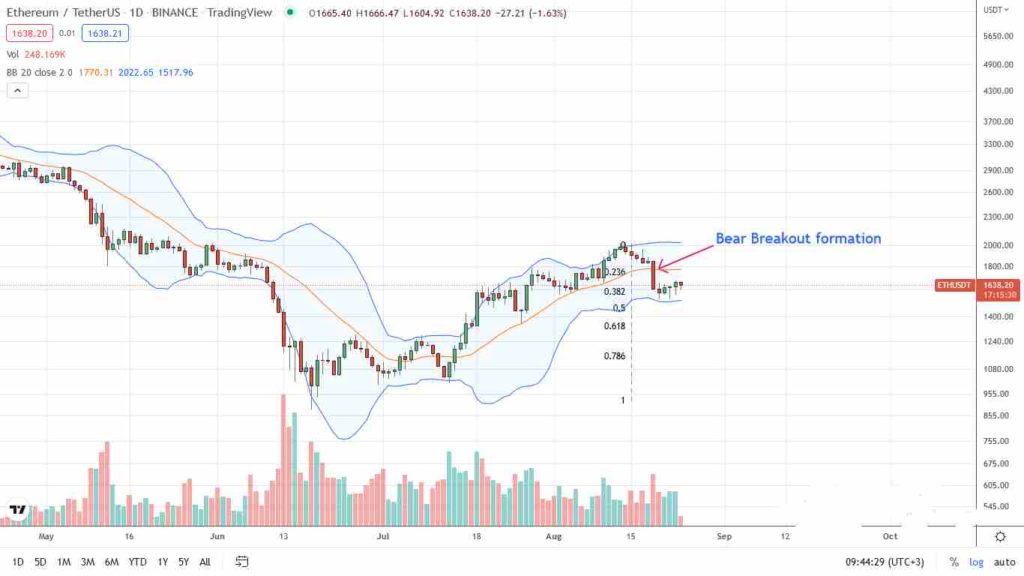
ETH prices are stable and inching higher but trading within the August 19 bull bar and above $1.5k primary support.
Overall, Ethereum appears to be pulling back, retracing after impressive gains in the past two months, which had seen the coin roughly double. Per the formation in the daily chart, every attempt higher towards $1.8k may present an opportunity for sellers to unload.
However, proper trend continuation will be established if ETH slides below $1.5k with equally high levels of participation, confirming losses of August 19. A high volume dip below the immediate support may see ETH drop to $1.3k, the 61.8 percent Fibonacci retracement level of the June to early August 2022 trade range, in a bear trend continuation formation.
On the reverse side, there will be a reprieve for buyers if ETH pumps above August 19 highs and the middle BB. This expansion may slow the sell-off and firm up buyers expecting a break above $2k towards $2.5k.
Technical charts courtesy of Trading View
Disclaimer: Opinions expressed are not investment advice. Do your research.
If you found this article interesting, here you can find more Ethereum News