
The Ethereum price has not been spared from the crypto dip.
Currently, the coin is down eight percent versus the USDT and trailing the BTC in the previous trading week. Overall, sellers appear to be in control, comprehensively reversing gains posted in late April 25.
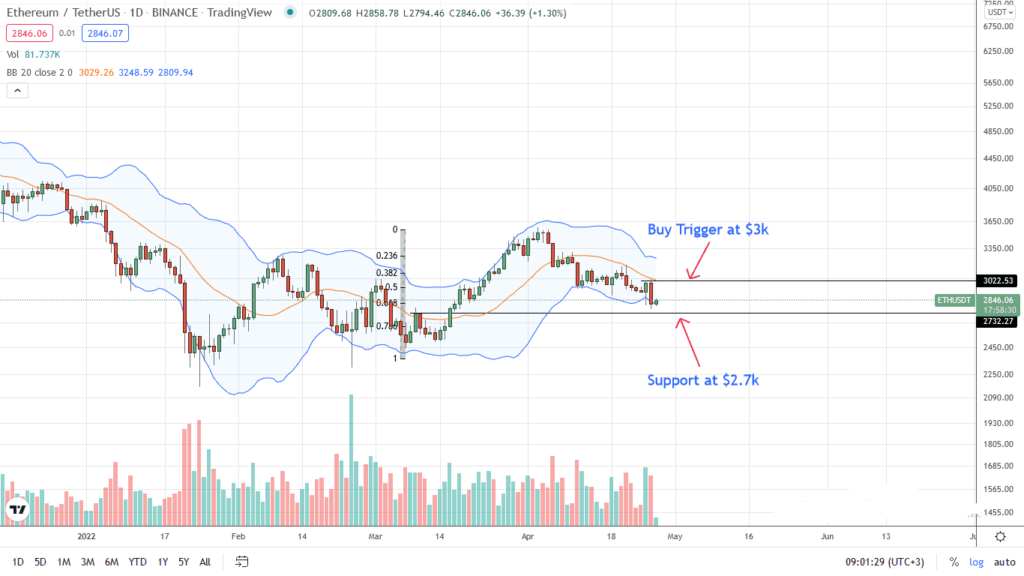
As per the candlestick arrangement in the daily chart, bears appear to be in control in a bear breakout formation following sharp losses in early April. The drawdown below the middle BB has since shaped immediate and medium-term price trajectory.
Vitalik’s Role in Ethereum Development Decreasing
It has emerged that Ethereum development is multi-pronged and pushed by a community of developers. There were concerns that Vitalik Buterin—the co-founder, was commandeering Ethereum development.
However, this is not the case reading from his recent comments. In an interview, the developer said his influence has reduced over the years.
“I feel like my influence in Ethereum keeps decreasing every six months. I have less now than I did six months ago. Six months ago, I had less than I had a year ago. And a year ago, I had less than I had 18 months ago.”
Some of his development proposals, he adds, have been rejected.
Adding:
“If you watch some of the [Ethereum Improvement Proposals – EIPs] that I promote, some of them don’t even make it. So for many of them, you have to try pretty hard to satisfy all people’s concerns.”
Ethereum Price Analysis
ETH is down eight percent in the previous trading week. Gains of April 25 were sharply reversed yesterday as bears flew back.
At spot rates, sellers are squarely in control. Specifically, ETH is within a bear breakout formation with the bearish engulfing bar of April 26, confirming sellers of April 11. In light of the development in the daily chart, traders may search for entries provided prices are capped below $3k—a psychological reaction level.
As per the arrangement in the daily chart, ETH may quickly slide to $2.7k and later $2.4k. These are key reaction points marking the 61.8 and 78.6 percent Fibonacci retracement levels of the Q1 2022 trade range.
Conversely, if ETH prices continue swinging, prices above $3.05k, the move would slow down aggressive sellers.
Technical charts courtesy of Trading View
Disclaimer: Opinions expressed are not investment advice. Do your research.
If you found this article interesting, here you can find more Ethereum News