
Although Bitcoin’s volatility and momentum dropped in the last half of the week, prices are firm at spot rates, looking at the performance of the previous few days.
BTC is technically higher, swinging from the lower BB, looking at the BTCUSDT trends in the daily chart. Of note, bulls are building on the gains of December 20, rejecting attempts to push prices lower.
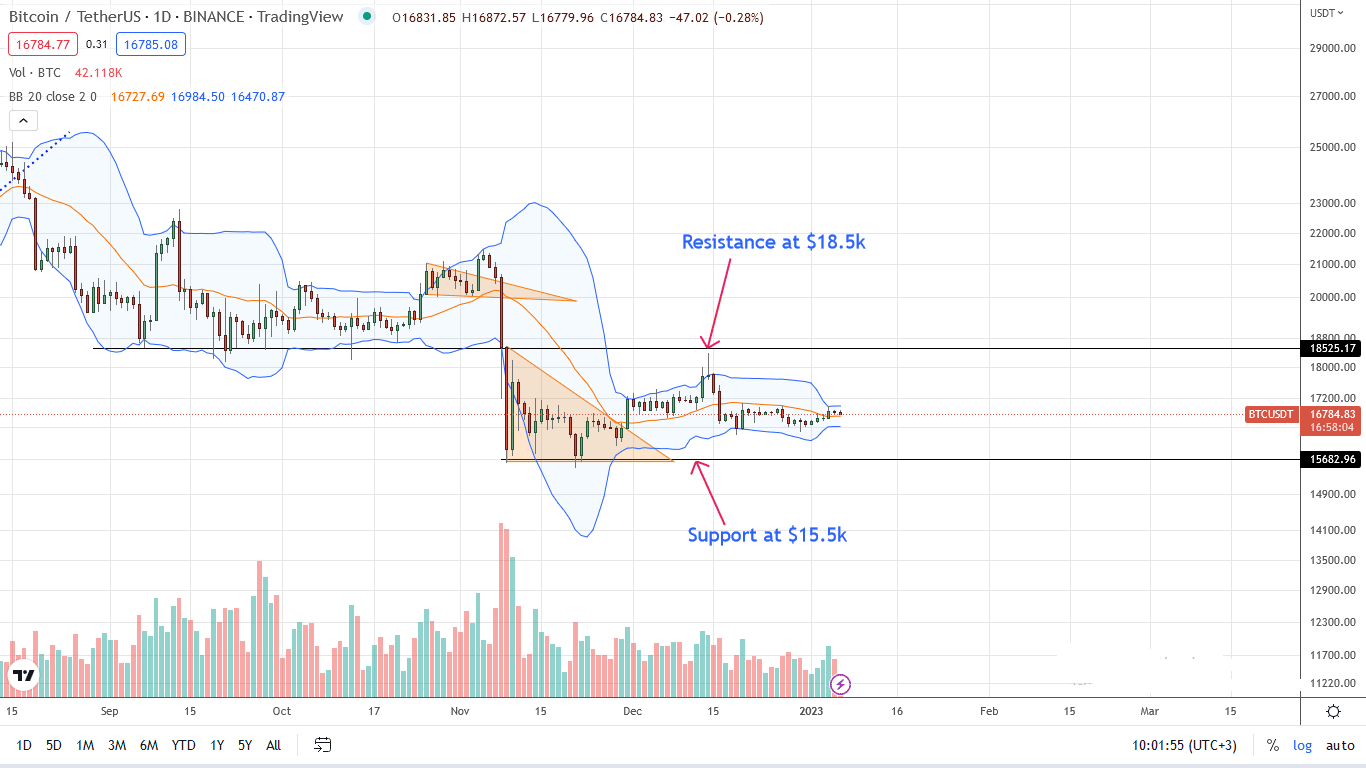
Even so, prices are below $17k and $17.5k resistance lines. For the uptrend definition, buyers must clear this liquidation line, and the expansion must be with rising trading volumes. In that case, not only will there be solid signals for uptrend development, but it could be the base for the next leg up towards $18.5k or better in subsequent sessions.
The Trough of Disillusionment
Considering the performance in the daily chart, Bitcoin appears to be in a critical position, analysts say. Specifically, one commentator, Pierre Rochard, on Twitter, said BTC price action is at the trough of disillusionment. This zone must be watched keenly.
In his assessment, it will be a matter of time before either BTC soars to the enlightenment zone or break lower, possibly sinking the entire crypto market with it. Even though there is no science behind this analysis, the analyst cites historical performance. He recommends that traders accumulate and look at the long term.
While at this, it will be seen whether the expected BTC halving of 2024 will impact the coin’s volatility, lifting it from the current abyss.
Bitcoin Price Analysis
Bitcoin is up 8% from November lows and looks firm.
Even though prices are broadly within a trading range, the path of least resistance is northwards in the short term. Before traders jump in and accumulate on dips, buyers must break above $17k.
Ideally, this breakout should be with rising trading volumes, confirming buyers of December 20. If this happens, the coin could break above $17.5k and surge above the critical liquidation line at $18.5k.
There is also a possibility of tanking since the primary trend is southwards from a top-down preview. Support lies at $16.5k. If there is a sharp contraction from spot rates, reversing encouraging signals early this week, the deleveraging might push BTC to new multi-week lows, possibly to $15.5k or worse.
Technical charts courtesy of Trading View.
Disclaimer: Opinions expressed are not investment advice. Do your research.
If you found this article interesting, here you can find more Bitcoin news.