
Bitcoin has had it rough in the past few trading days, reading from the performance in the daily chart. Even though the coin could be back in green in the past 24 hours versus the USDT, where it is up a decent nine percent, the primary trend is bearish.
Notably, as per the general candlestick arrangement, BTCUSDT is within a bear breakout formation with clear resistance at $32k and $34k in the immediate term.
These are crucial reaction lines flashing with Q1 2022 and H2 2021 lows. If BTC bulls surge from spot levels, shaking off sellers and break above these liquidation levels, it may spell the end or slowdown of bears of the past trading week.
UST de-Pegging and LUNA sell-off
From a fundamental perspective, the sell-off could be pinned to the destabilization caused by the LUNA sell-off and UST de-pegging and the drastic actions by the Luna Foundation Guard (LFG).
The latter, in a desperate attempt to keep the peg, liquidated all their BTC reserves worth over $2 billion.
It was this necessary sell-off and saving face that heaped pressure on BTC, causing it to drag the crypto market with it.
Amid the dump down, hundreds of millions of BTC long positions were liquidated in a domino effect that traders are still reeling from.
Tether De-pegging Concerns
Additional market apprehension also came from concerns about USDT de-pegging. For a brief moment mid this week, USDT moved five percent down from $1, causing jitters.
A collapsing USDT could be consequential for crypto but likely to support BTC, a store of value digital asset.
Bitcoin Price Analysis
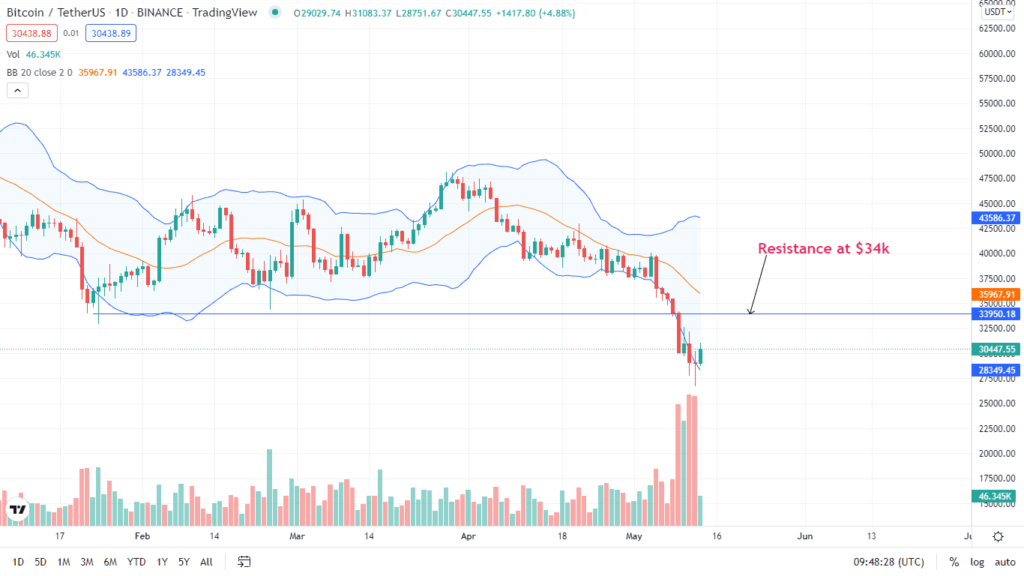
BTC is up 10 percent in the previous trading day but within a bear breakout formation below $32k and $34k. These lines flash with H2 2021 and Q1 2022 lows.
Therefore, while the market remains apprehensive, taking a wait-and-see approach, risk-averse traders may wait for clear trend formation in the immediate term. The May 13 bull bar is wide-ranging, reversing losses of May 12.
However, it is still within the May 11 bear bar and defined by the May 9 bear breakout candlestick. Every attempt towards $32k and, later $34k, would be nothing but a retest. It is a move that may see aggressive bulls ride the trend higher.
This bullish preview will only be valid once there is a sharp breakout above $34k, unwinding losses of May 9, that may permit buyers to load the dip, targeting $37.3k. Conversely, a sharp reversal from spot rates to below $26.7k, or May 12 lows, could pave the way for further dumps towards $20k—or worse.
Technical charts courtesy of Trading View.
Disclaimer: Opinions expressed are not investment advice. Do your research.
If you found this article interesting, here you can find more Bitcoin news.