
Bitcoin prices have been both hot and cold. The freeze of September 20 was countered by the warmth of September 22, which offered a relief rally for permabulls.
When writing, BTC prices are pretty much constant, oscillating within a tight range above January 2021 highs.
Waving Bitcoin Price Action
The bounce from the expected reaction zone was a sigh for traders who, after September 20 dip, expected the worst.
Admittedly, even with these losses, the uptrend is still shaky from an Effort-versus-Results perspective.
For example, in the weekly chart, there is a double bar bearish reversal pattern.
At the same time, in the daily chart, BTC prices are still trending below the 20-day moving average.
Besides, despite the recovery of September 22, the bar has lighter trading volumes.
From volumes analysis, this is week and doesn’t bode well for chartists who still sense weakness in the uptrend, potentially more room for even more losses in the days ahead.
Bitcoin On-Chain Indicators
Interestingly, on-chain indicators point to strength and market confidence.
For instance, the Bitcoin hash rate is bouncing back higher after dips of June following the ban from China.
Whales buy tend to buy when BTC price is cheap and then distribute to retail as the market gains momentum.
— Will Clemente (@WClementeIII) September 22, 2021
Whales have begun accumulating again since late July, after selling since February. pic.twitter.com/fXVKYBr7fl
Meanwhile, an on-chain analyst says that more whales have “diamond hands.” In his observation, whales have been purchasing coins since July, when prices were relatively lower before redistributing to retailers in subsequent sessions.
84% of #Bitcoin have not moved in +3 months. pic.twitter.com/k60qDAe9tm
— Bitcoin Archive (@BTC_Archive) September 23, 2021
Also, there are now more HODLers than sellers in the past three months. Roughly 84 percent of all coins remain unmoved in three months, a net positive signaling market confidence.
Bitcoin Technical Analysis
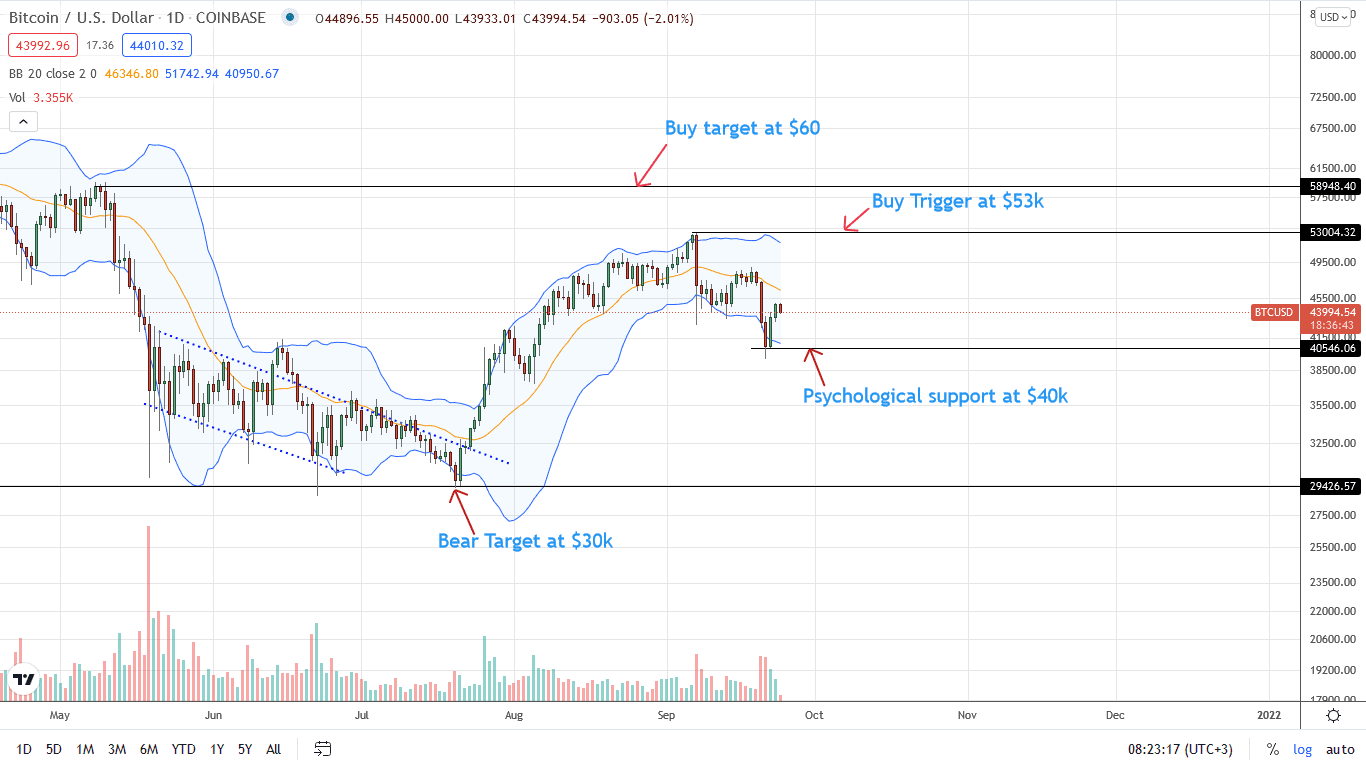
From the daily chart, the BTC price is trading within a tight range. As of writing, BTC is stable against the greenback on the last trading day but down eight percent week-to-date.
Notably, there is a double-bar bullish engulfing pattern, possibly marking the lows of this week. Despite the upswing, the bull bar has low trading volumes, and there is no high-volume through-put affirming bulls and bear trend reversal.
Additionally, since BTC prices are below the 20-day moving average, a dynamic resistance—previous support—every pullback may offer entries for sellers angling for $42k in the short term.
Even so, a close above $47k—reversing September 20 loss—would invalidate the downtrend, setting in motion the next wave of higher high that could see Bitcoin top $60k.
Conversely, if bears unwind gains of September 22 to below $42k, BTC might crater to $36k in a bear trend continuation pattern.
Technical charts courtesy of Trading View
Disclaimer: Opinions expressed are not investment advice. Do your research.
If you found this article interesting, here you can find more Bitcoin news