
The Bitcoin price remains in a momentum-sapping consolidation as per the development in the daily chart.
When writing, the path of least resistance is still northwards—at least from a top-down approach—but under pressure in the short term.
Because of the waning upsides, BTC is on the brink of posting lower lows should the support zone between $58k and $60k fail to hold.
The Bitcoin Futures ETF
At the back of Bitcoin’s recent tailwinds was the approval of the Bitcoin Futures ETF by the U.S. SEC.
The regulator took the step for the first time to greenlight the complex product after years of several administrations rejecting a Bitcoin ETF.
Given their mandate of protecting citizens, the regulator cites the lack of sufficient monitoring tools and the high manipulation among cryptocurrency exchanges.
Rampant wash trading, low regulation and compliance among exchanges, and hacks caused the SEC to pull back and crash any Bitcoin ETF application requests.
However, it came to an end with the approval of a Bitcoin Futures ETF approval.
It is a product that tracks the Bitcoin Futures price, not the spot market, unlike similar products approved by Canadian and Australian regulators.
Rep Tom Emmer: The SEC should Approve a Bitcoin ETF
For this reason, Rep Tom Emmer has sent a letter to Gary Gensler–the chair of the SEC– seeking explanations as to why a Bitcoin Futures ETF should trade and not the one that directly tracks the spot rate of the digital gold.
Today I sent a letter to @GaryGensler with my @blockcaucus co-chair @RepDarrenSoto about Bitcoin ETFs. It doesn’t make sense that Bitcoin futures ETFs are allowed to trade but Bitcoin spot ETFs are not. pic.twitter.com/k1WTF0HA0U
— Tom Emmer (@GOPMajorityWhip) November 3, 2021
In his view, the SEC should allow the trading of a Bitcoin ETF, opening more avenues for investors to tap into the growing cryptocurrency market.
Bitcoin Price Analysis
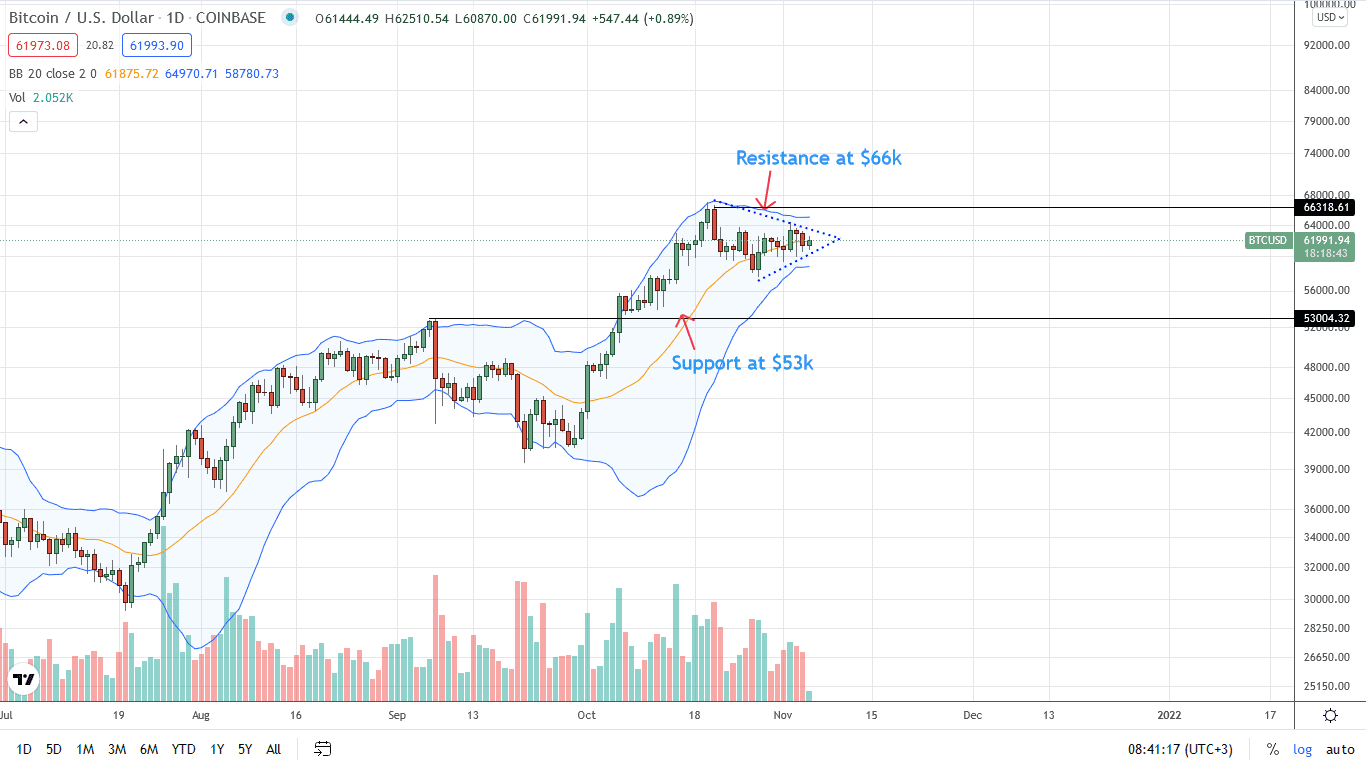
The BTC price remains in a sideways trend, trailing the USD on the last trading day. Overall, Bitcoin buyers are in control, but the upside momentum is waning as trading volumes—a gauge of participation—shrinks.
In the short term, the immediate support line is at the psychological $60k level. On the lower end, the limit stands at $58k. A close below this $2k layer may draw sellers, forcing BTC/USDT prices back to $53k in a retest and cool-off.
However, if buyers flow back, breaking above the wedge—the pennant–, BTC bulls might find the strength to edge above $67k—the all-time highs—for another swing towards $96k—the 1.618 Fibonacci extension level of the H1 2021 trade range.
As per the candlestick arrangement, traders can adopt a wait-and-see approach for better trend definition in the short term, keeping track of the critical reaction levels.
Technical charts courtesy of Trading View
Disclaimer: Opinions expressed are not investment advice. Do your research.
If you found this article interesting, here you can find more Bitcoin news