After two quarters of Bitcoin bulls emerging, hints are pointing to an end of what has been an epic rally. While there are mere indicators, fundamentals are strong.
At the time of writing, the Bitcoin price is down below $18k with weak bulls. Technical candlestick arrangement may suggest a possible correction but developments in the United States could help steady price at spot rates.
Fidelity Digital and BlockFi Partnership
Fidelity Digital Assets in partnership with BlockFi now support Bitcoin collaterals for clients seeking to take cash.
As experts in digital currency custody, their role in this arrangement will be to safe-keep client’s coins while they receive cash loans as long as they have a BlockFi account. It is early, and support from a leading bank with trillions under management, and notably planning to expand to Asia is a massive vote of confidence in crypto.
The journey is still early; DeFi is here and laws are yet to catch up. Whether that will be grinding or supportive is largely reliant on the state of affairs and if what Fidelity Digital Assets set in motion has the wheels and the mojo for others to follow suit.
The Mt Gox Rehabilitation Plan Deadline
In the immediate term, the events of Dec 15 will have a bearing on BTC prices. Admittedly, the Mt Gox heist of 2014 is still being felt.
Early next week, as part of the Rehabilitation Plan, 140k BTC will be distributed to rightful owners following the exchange filing for bankruptcy and closing after the devastating hack.
Bitcoin Price Prediction
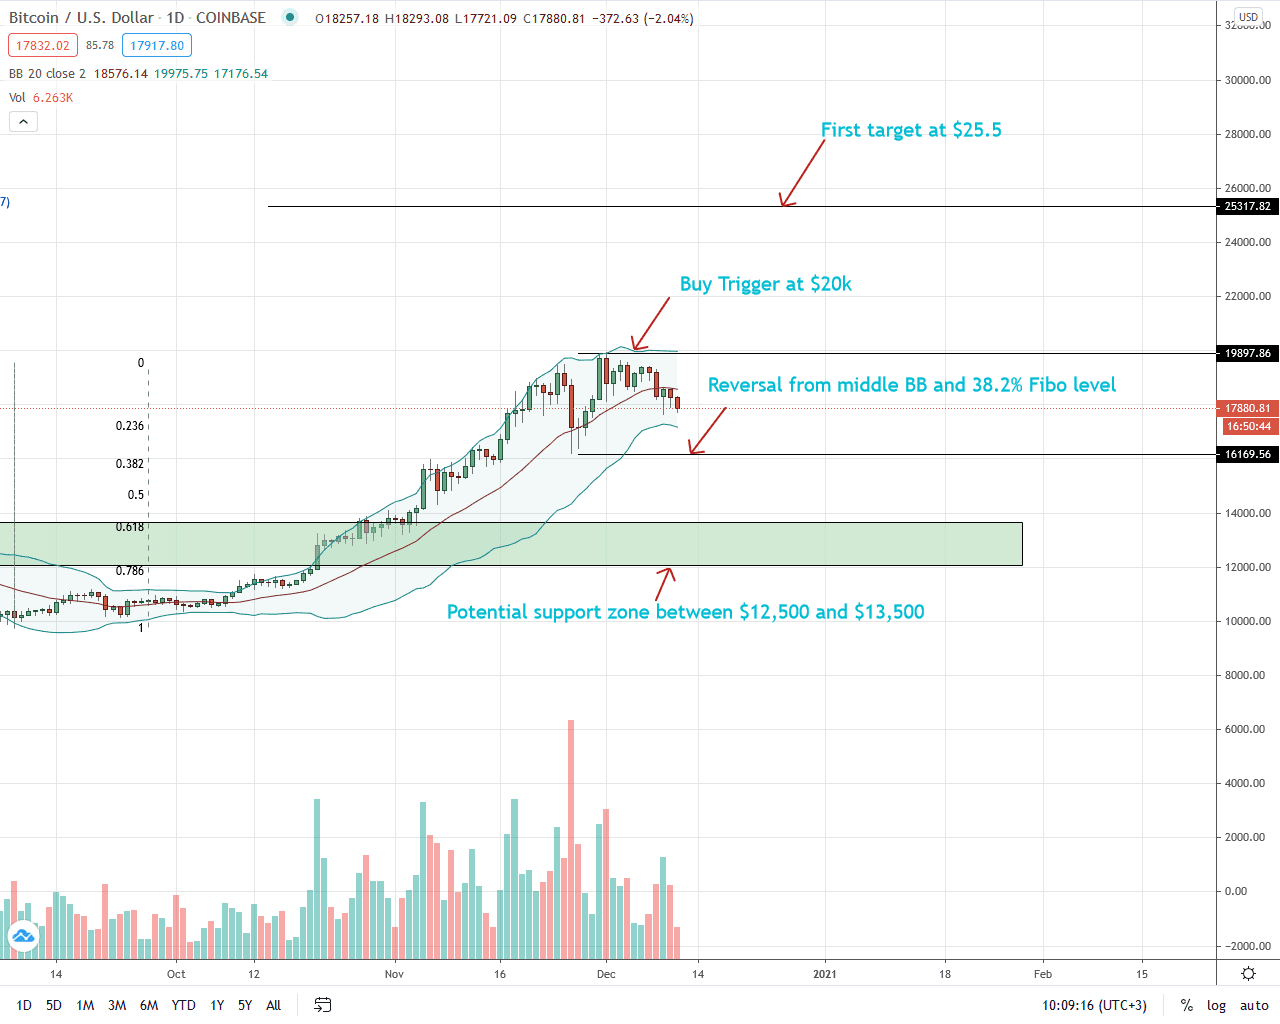
The BTC/USD price is down seven percent in the last week of trading. From price action in the daily chart, bears appear to be in control.
Although yesterday’s bar was bearish with a long lower wick pointing to bulls in lower time frames, its close was below the flexible support line marked by the middle BB.
It followed through Dec 9 bar that closed below the 20-day moving average with a long lower wick suggesting demand.
If today’s bar is bearish and closes below the middle BB, it shall confirm a bear breakout pattern—breaching the support line for the first time in over 60 days.
In this case, scalpers can aim at $16k—the 38.2 percent Fibonacci retracement level of the October to November 2020 trade range. Aggressive traders, on the other hand, can aim for deeper targets at June 2019 highs of around $13.8k—completing a retest.
If prices recover (unlikely) and breach $20k with high trading volumes exceeding those of Nov 26 (Coinbase data), the BTC/USD pair will highly likely rally to $25.5k, the 161.8 percent mark of the Fibonacci extension level anchored on Oct to Nov 2020 trade range.
Chart Courtesy of Trading View
Disclosure: Opinions Expressed Are Not Investment Advice. Do Your Research.
If you found this article interesting, here you can find more Bitcoin news