These chaos is why Bitcoin exists. At the peak of the depressing Great Financial Crisis of 2008-09, Bitcoin was rolled out.
It promised decentralization and transformation of one’s self into an independent bank. That came to pass and throughout the last decade, BTC became the de facto leader in crypto. The coin is the most valuable and sought after.
Bitcoin as a shield
With the FED and other central banks planning to significantly ease in light of the coronavirus epidemic, it’s only sensible, even natural, for savvy investors to have a shield in Bitcoin. An unlimited QE inevitably leads to high inflation and inflation is the purchasing-power nibbling carnivore that wealth preservers are wary off.
For this, it is emerging that despite short-term treasuries being in negative zone, highlighting how the investment community is doubtful of the future economic state of the US, most are funneling their cash to treasuries.
Self-Preservation
Not Bitcoin as expected. This, one analyst explains, is because of the low velocity of cash at this crisis pinch. With lockdowns and the economy ransom by COVID-19, people are rushing to buy the necessities, not investing.
DeFi data scientist, Alex Kroeger, explains that in the immediate term, people are hoarding cash for self-preservation and its velocity will remain low despite Donald Trump and the FED being in overdrive printing cash.
BTC/USD Price Analysis
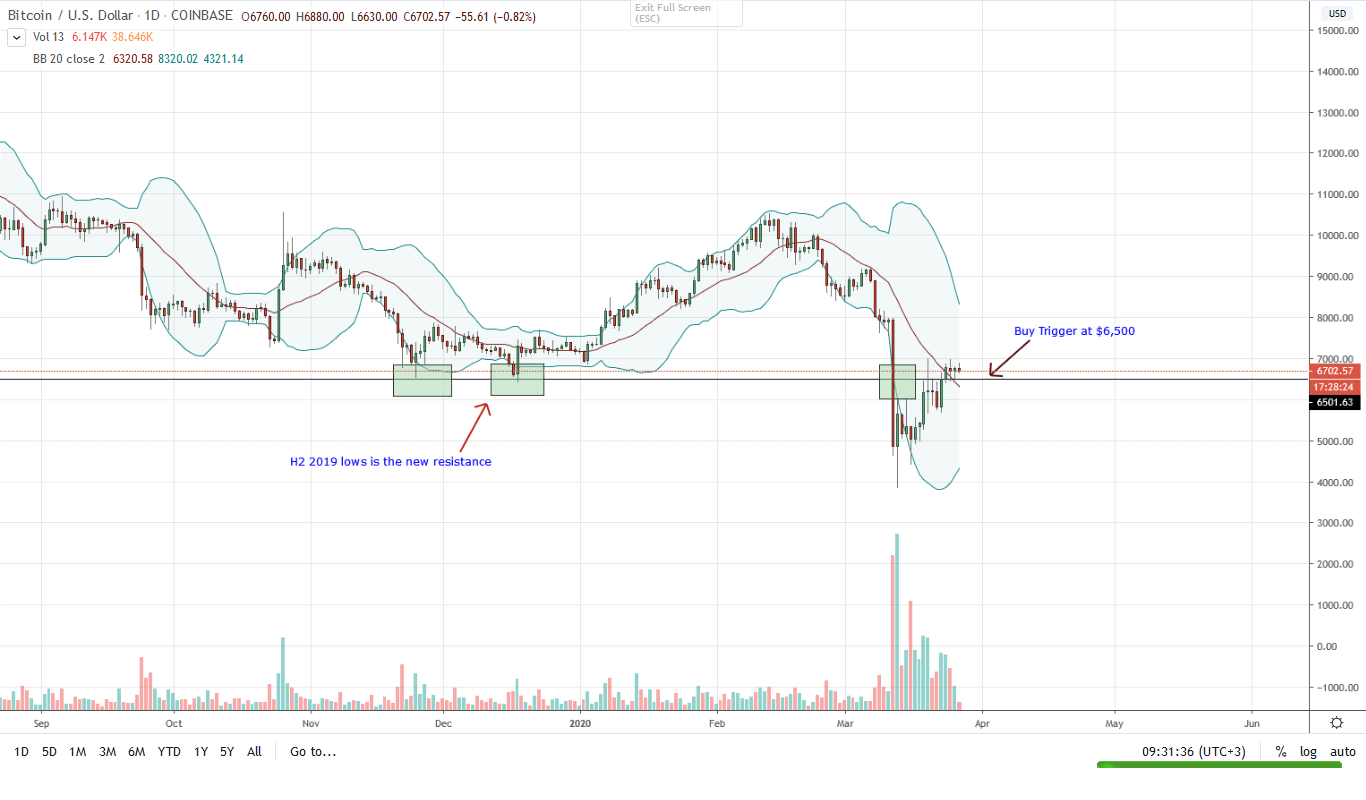
BTC prices are steady and continue to trade in a tight range in the last three days. Interestingly, this is forming at a key resistance, previous support, at the $6,500-700 zone.
The result is a classic spinning top, a mark of distribution or possibly accumulation depending on the direction of breakout. With halving in the next few weeks, traders are positioning themselves for a re-pricing.
For now though, it is wise for risk-averse traders to wait on the sidelines until a clear direction is printed.
Any break above this resistance area and close above H2 2019 lows with high trading volumes will spark a wave of buys that may see BTC rally to $9,500 and eventually $10,500 high of Feb 2020.
On the flip side, a bear candlestick shall confirm the bear breakout of Mar 12 and BTC may disintegrate back to $4,500 or Mar 13 lows of $3,800.
Chart courtesy of Trading View – Coinbase
Disclaimer: Views and opinions expressed are those of the author and is not investment advice. Trading of any form involves risk. Do your research.