Jay Clayton of head of the United States Securities and Exchange Commission (SEC) made a confession on CNBC’s Squawk Box. He admitted the current payment mechanism is inefficient. The inefficiencies in the legacy network is fanning Bitcoin bulls, driving prices towards the all-time high of $20,000.
In the SEC’s assessment, Bitcoin is a utility and a system for storing value. However, Michael Saylor, a Bitcoin advocate and a bull, is confident that the network goes beyond just being a “store of value” and a utility as Jay describes.
The executive thinks of Bitcoin as a perfectly engineered store of value that is better than gold whose rise demonstrates that technology partners should be tasked with building payment rails, deferring currency matters to governments.
Undoubtedly, and referring to the community’s assertions, BTC is a bona fide store of value that can also serve as a medium of exchange. Due to the coronavirus pandemic and the subsequent intervention from central banks, air dropping money and debasing fiat currencies, analysts are convinced that hyperinflation will be inevitable.
Because of the FED’s mismanagement of monetary policy, safe havens and specifically Bitcoin will benefit from capital flight from traditional markets like the stock market. The Winklevoss Twins assess the Bitcoin price to rise to $500k.
Meanwhile, basis his projections on technical analysis, a Citibank executive and analyst, Thomas Fitzpatrick, said BTC prices could rally to $300k by Dec 2021. The current market state, he said in a newsletter, is very reminiscent of the gold markets of the 1970s.
Bitcoin Price Analysis
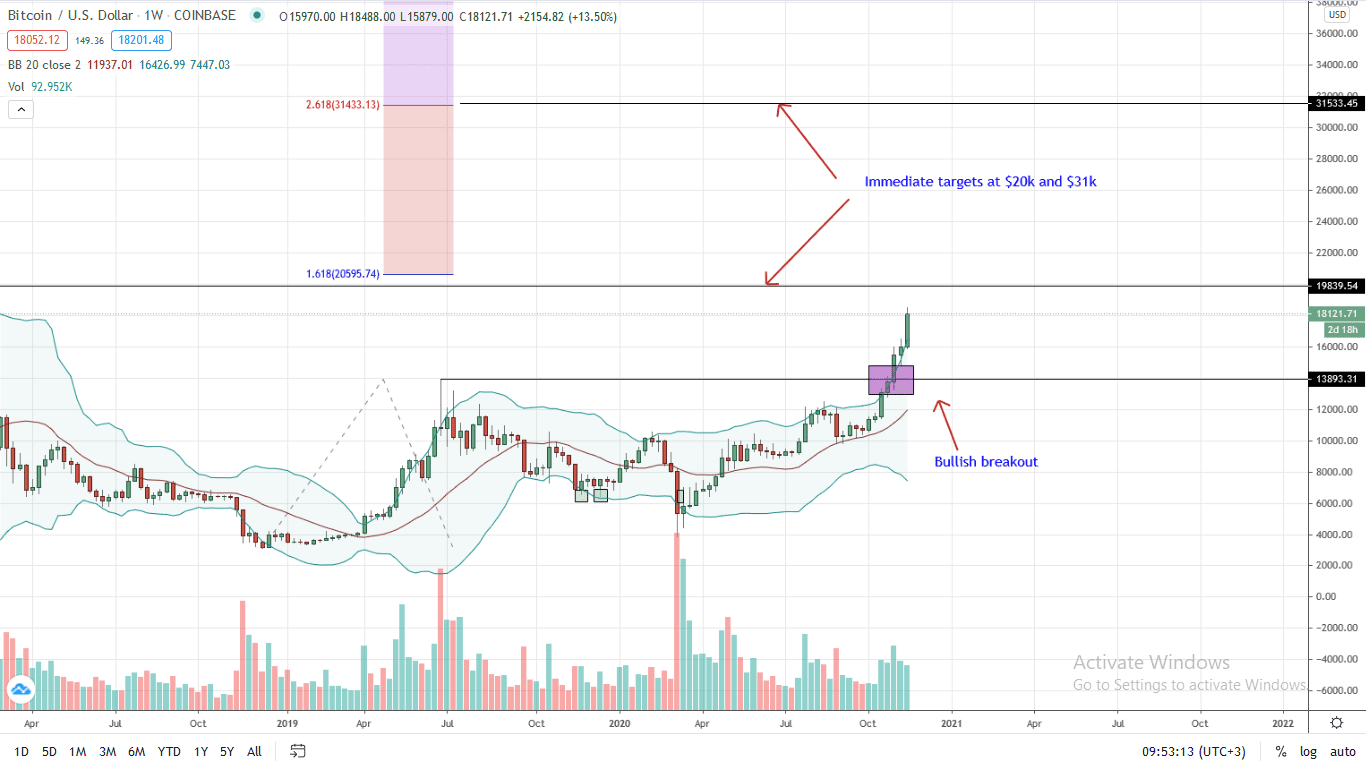
BTC/USD Price Chart Weekly Chart for Nov 20
In the last week of trading, the Bitcoin price is up 12 and six percent, respectively against the USD and ETH.
From the weekly chart, BTC prices are trading within a bullish breakout pattern. After the high volume break and close above $12,500, bulls have been relentless. Candlestick arrangements point to demand and high momentum. Notably, bull bars are banding along the upper BB. Also, the divergence between the lower and upper BB points to high volatility that can benefit aggressive traders.
Adopting a conservative approach against FOMO, the reaction at Dec 2017 highs of around $19,900 will be shaping for the Bitcoin price. Ideally, if the break is with high trading volumes, odds of BTC prices rallying to $21k and $31k, the 161.8 and 261.8 percent Fibonacci extension levels remain high.
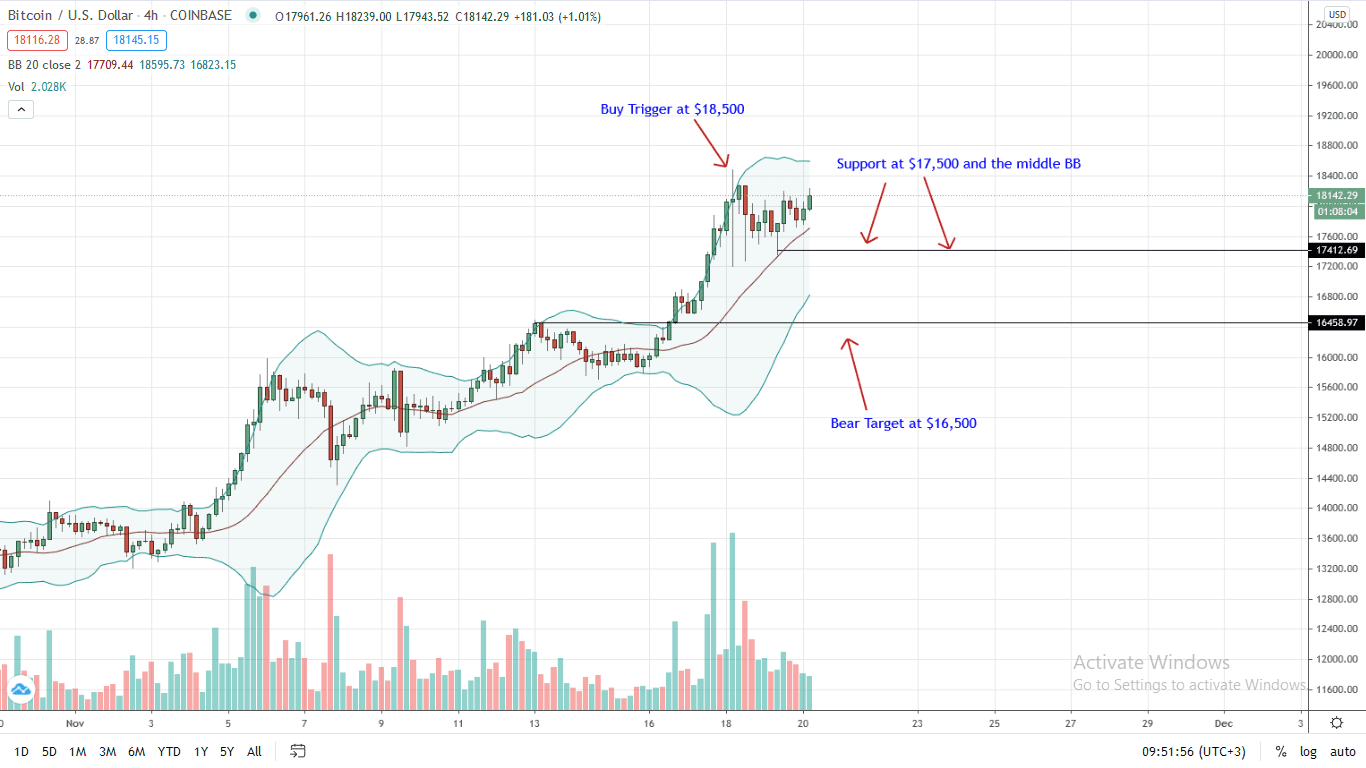
BTC/USD Price Chart 4-HR Chart for Nov 20
Conversely, if bulls fail to close above this week’s highs of $18,500 and prices break first, below $17,300 and the middle BB (clear in the 4-HR chart), a contraction back to $16,500 and $13,000 is possible.
Chart courtesy of Trading View
Disclaimer: Views and opinions expressed are those of the author. This is not investment advice. Do your research.
If you found this article interesting, here you can find more Bitcoin news