
Generally, Bitcoin prices are ranging as our analysis points out. Before we conclude on recoveries or trend continuation, prices should break out above $7,200 backing bulls or below $5,800 confirming trend resumptions.
Latest Bitcoin News
The proliferation of cryptocurrencies should not solidify assumptions that the market is mature—more like banks that have been around fine tuning for decades. Some European banks have been around for centuries. Fact is Blockchain and Bitcoin is but a decade old basically making Bitcoin a baby whose “limbs” are yet to strengthen.
That’s why supportive regulations and jurisdiction specific laws—or abrupt declarations in that case should not stifle growth but rather accelerate development of a technology that’s already proving to be better, faster and unfortunately unsettling for banks—the status quo.
By design, the inner working of Bitcoin and similar platforms that employs the proof of work consensus algorithm can strain power grids is true. However, this was expected as Bitcoin—a $100 billion digital asset, continues to take root. Recent announcement by energy companies in Central Washington that they shall hike electricity costs to $0.085 per KW for home miners but inflate that of industrial miners to $0.060 per KW should be a cause of concerns for Bitcoin maximalist keen on maintaining decentralization.
What’s even distracting is that there is a pattern forming and this law was passed weeks after Canada’s Hydro-Quebec passed the same law doubling cost of electricity for miners citing grid strain. No doubt, once Central Washington implements this unpopular decision by end of Q1 2019, miners would migrate in droves in protest.
Bitcoin Price Prediction 21/09/2018
Weekly Bitcoin Price Charts
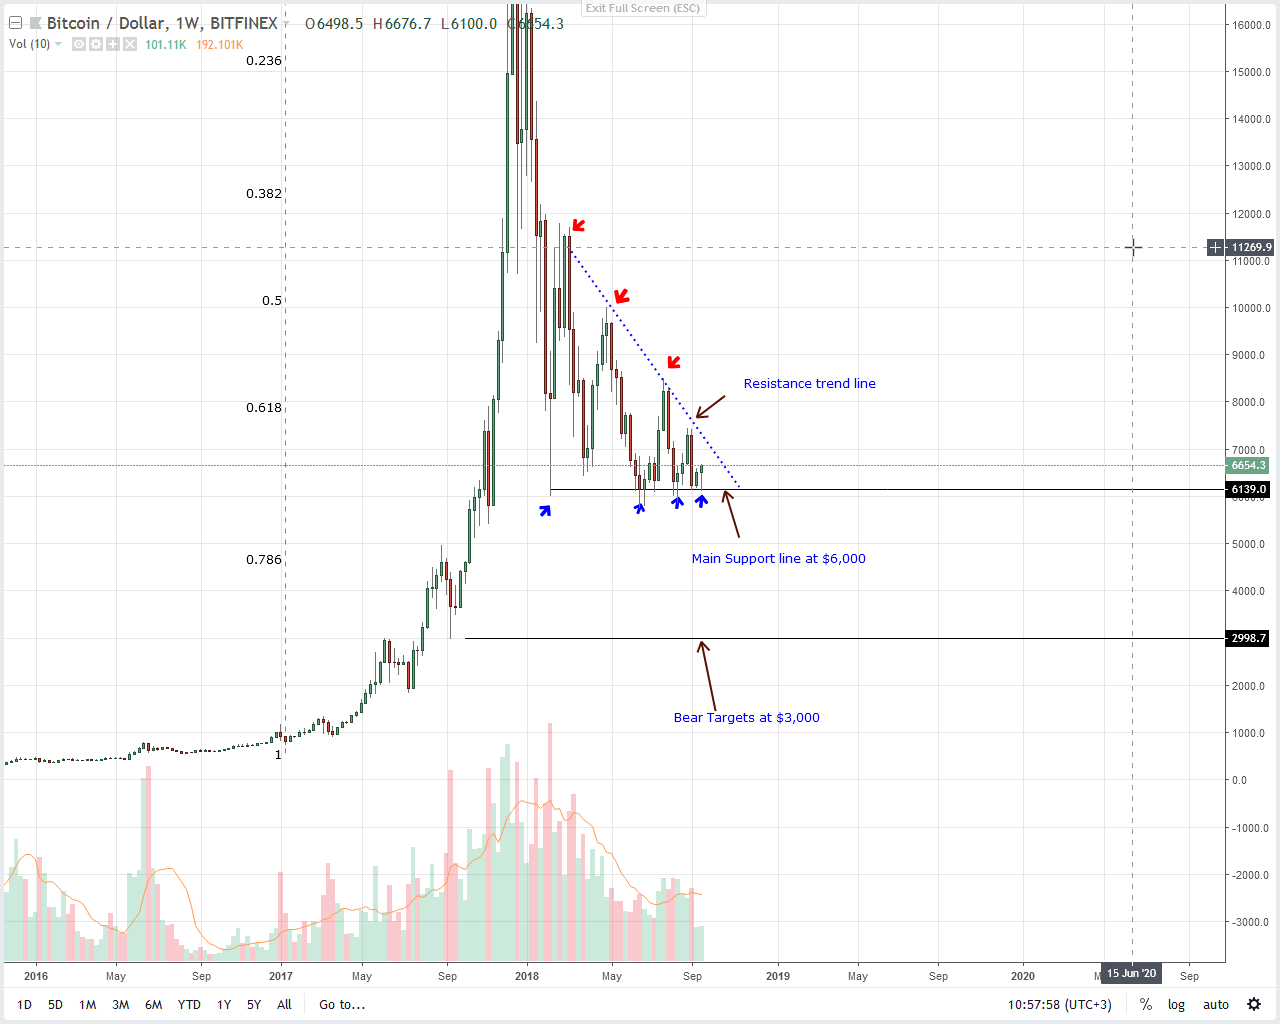
Technically, Bitcoin prices are in a range mode with virtually nothing unchanged just like as projected in our last Bitcoin price analysis. While bears are in charge, buyers are building up momentum preventing further losses below $5800–$6000 support line.
Regardless of this support, Bitcoin traders need to see movements above $7,200 or week ending Sep 9 and Aug 12 just above the resistance trend line to activate medium to long term buys on dips with ambitious targets at $10,000 and $12,000.
A counter move on the other hand means a decline below $6,000 and a possibility of driving miners out of trade triggering other domino effects should prices drop to $4,500 and even $3,000.
Daily Bitcoin Price Charts
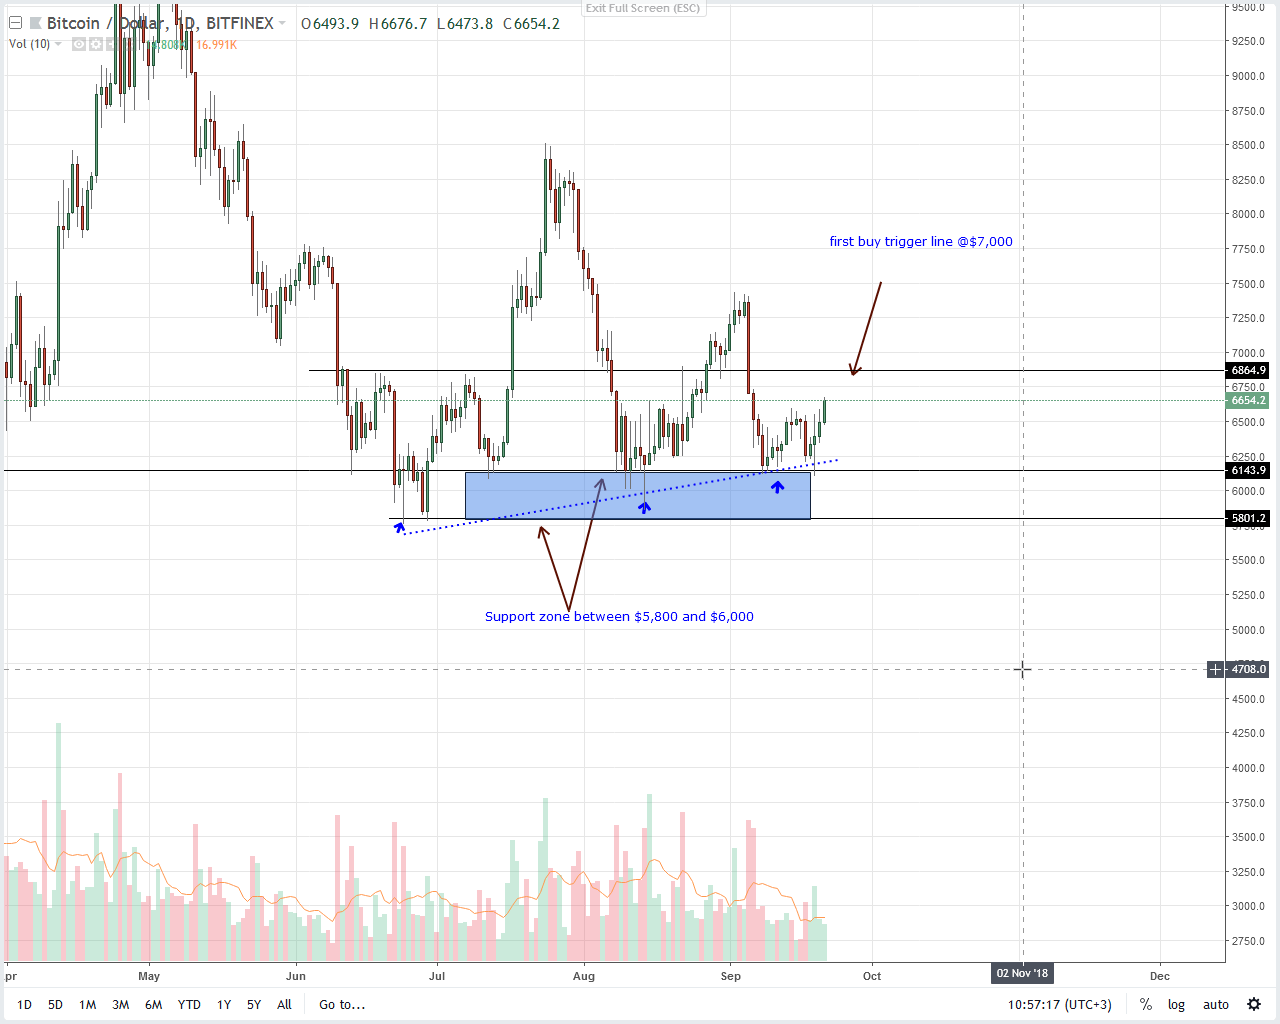
In this time frame, prices are stable and oscillating inside Sep 19 high volume, high-low. Though prices seem to be bouncing off the three-month support trend line, there is the liquidating effect of Sep 17 bear candlestick which was accompanied by abnormally high volume.
And this is not positive for bulls not unless there are strong moves first above $6,500 all thanks to similar Sep 5 bear candlestick that is most likely being confirmed.
All in all, we retain a neutral stance and cautiously optimistic with trade executions only done at the back of fitting trade triggers laid out in our trade plan.
Disclaimer: Views and opinions expressed are those of the author and aren’t investment advice. Trading of any form involves risk and so do your due diligence before making a trading decision.