
Bitcoin recently broke the $68K resistance level, and it seems a continued uptrend may happen in its price chart. On-chain analysis shows that Bitcoin can validate the price between $50K and $60K, and a dropping below this zone is not probable. According to the on-chain analyst, Willi Woo:
Contour map of every bitcoin at the price they last changed hands between investors. Huge price validation between $50k-$60k.#Bitcoin as a $1T asset class IMO is now cemented; hard to see it dropping below this zone.
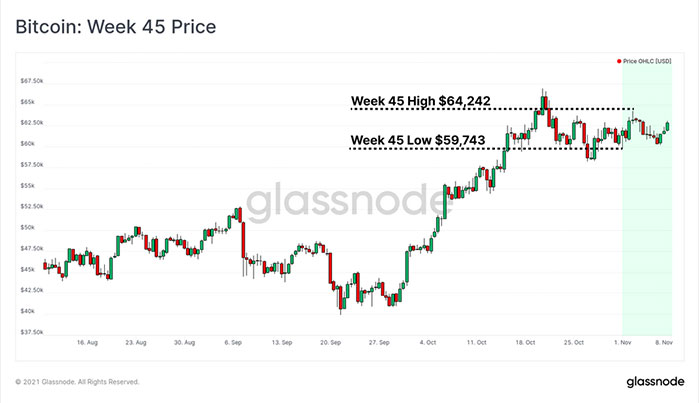
This data is @glassnode's URPD visualised. pic.twitter.com/pHBlXrk1hs
— Willy Woo (@woonomic) November 8, 2021
“Contour map of every bitcoin at the price they last changed hands between investors. Huge price validation between $50k-$60k. #Bitcoin as a $1T asset class IMO is now cemented; hard to see it dropping below this zone.”
One of the most important metrics in analyzing the price trend for Bitcoin is exchange inflows and outflows. Glassnode published an on-chain analysis about this metric and said the exchange balances are continuously decreasing. A continuous outflow means people are confident about the price moves and are moving their assets out of exchanges. It shows a HODL signal that can help the uptrend continue stronger.
The latest analysis by Glassnode shows some interesting facts about the on-chain activity on the Bitcoin network. Although the last week has been a great one in terms of consolidating the price, the on-chain activity is still below bull market highs. But it’s still marginally above bear market levels.
The combination of metrics shows an optimistic future for Bitcoin in terms of activity and price. According to the analysis:
“This combination of strong supply dynamics, mining network recovery, and relatively low network activity points to a fairly constructive outlook for Bitcoin over the coming weeks.”
The overall stats of the market indicates an accumulation phase in the Bitcoin network. The price is new ATH, and some new ATHs may happen in the coming weeks. On the other hand, the on-chain activity is near bear market lows and shows a divergence in the market. After all, low activity, new ATHs, large exchange outflows, and modest strategic spending by long-term holders combinate to promising stats for Bitcoin.
Bitcoin can act as an index for the cryptocurrency market. When new ATHs happen in its price chart, many new traders try to join the trend by buying the coin. They cause more demand in the market, and the prices continue to go up. It creates a bullish market for altcoins, too.
Many traders look for promising altcoins to earn more from the market. The current stats of Bitcoin indicate we can expect more ATHs in the charts. But nothing is impossible in this market. Some whales may start to sell their holdings in ATH and cause price corrections over time, for example.