
Fundamentally, it has been an eventful week. Safe haven assets including Bitcoin, Gold and select fiat currencies like the Yen benefited from geopolitical tensions.
The US and Iran, following the assassination of one of Iran’s influential military figures, General Qassim Soleimani, was at the verge of war.
Bitcoin as a Safe Haven
Its ramification, should there be a fallout will have far reaching consequences with the stock market at the receiving end. With the way Bitcoin and cryptocurrencies is structured, the coin is censorship resistant and over time, its has been serving a duo function, acting as a store of value and a medium of exchanges. Evidence is from the number of generated public addresses over time.
Trade Wars and Hash Rate
Add this to the ongoing negotiation between the US and China in the so-called trade war, traders and investors were on the edge across the board. With the recovery of Bitcoin following last year’s depressed price action, some analysts are confident that Bitcoin is on the early stages of a possible rally that will see the asset expand ahead of May 2020.
As BTC spearheads the crypto market revival, the network’s computing power, hash rate, has increased as miners respond by switching on their mining rigs because of better prices. This is a net positive and reaffirms the incentivization model in Bitcoin structure that makes this possible.
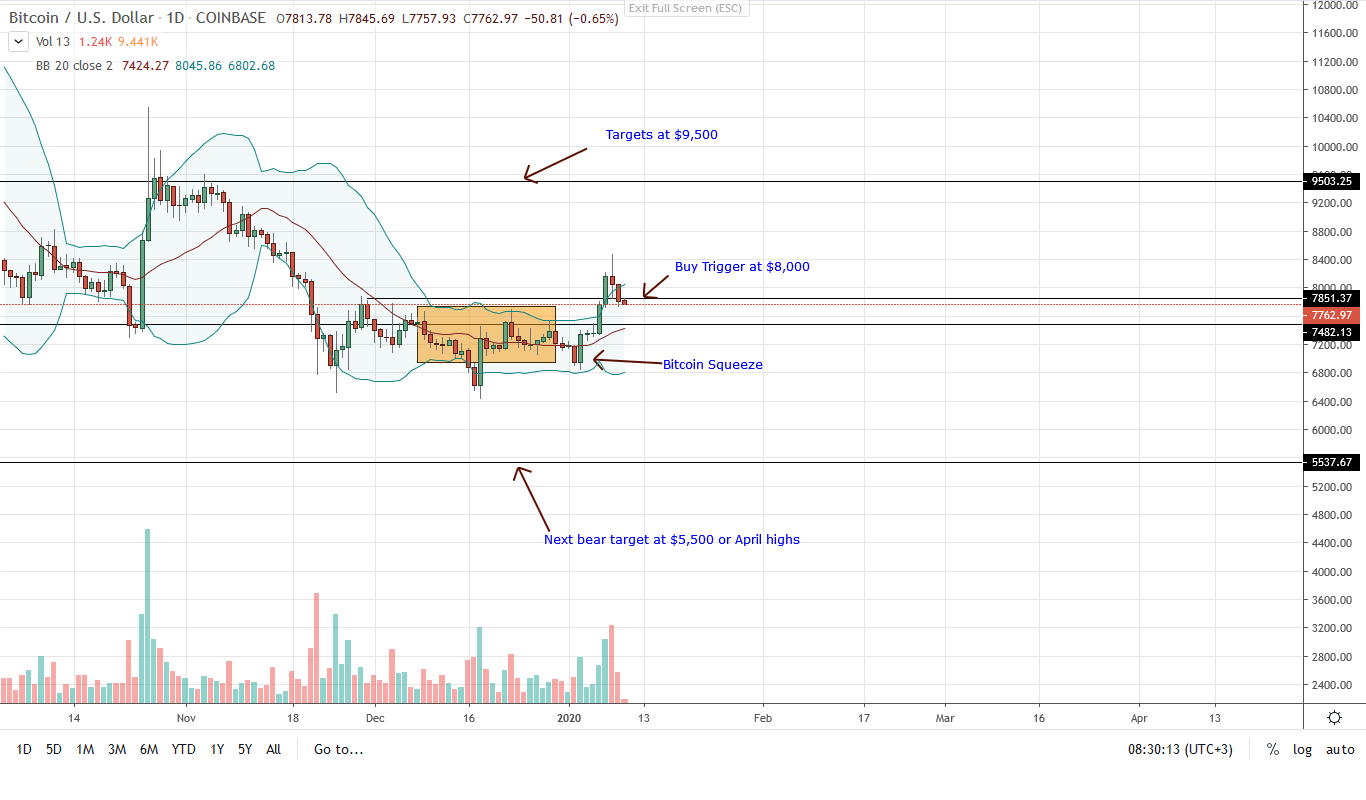
BTC/USD Price Analysis
It appears that Iran is standing down at the back of rumors that they were deliberate not to inflict US casualties in their recent missile launch against a US base. This de-escalated the situation and although this is not causation, BTC prices have since cooled down.
At press time, BTC is down 2% in the last day but up 11% in the past 7 days of trading versus the USD. From the daily chart, the uptrend is still firm. However, BTC is over-valued. On Jan 8, a full bear bar closed above the upper BB meaning price action will first seek to correct this, forcing prices down to equilibrium.
Considering the existing trend, risk-off traders can buy the dips and aim for $8,500 and $9,000. However, caution should prevail despite the excitement in crypto circles. In the weekly chart, this week’s bar is retesting the 20-week MA, an important resistant level.
If prices comprehensively close above $8,000 with high trading volumes registered this week, then buyers can flow back, increase their loads with targets as mentioned above. That will confirm the double-bar bull reversal patterns of Jan 02-03 and that of Dec 17-18, igniting the next wave of bull pressure.
Chart courtesy of Trading View-Coinbase
Disclaimer: Views and opinions expressed are those of the author and is not investment advice. Trading of any form involves risk. Do your research.