
The U.S. Commodity Futures Trading Commission (CFTC) is suing BitMex, one of the world’s largest crypto derivatives platform, after join charges were presented by the DoJ and the regulator.
In a civil enforcement action filed at the U.S. District Court for the Southern District of New York, the regulator came reigning down on the exchange accusing it of running an unlicensed exchange while allowing U.S. customers to trade.
It came like a bombshell for the trading market. Drawing consistent daily trading volumes of over $.5 billion, the Arthur Hayes-led Seychelles-based platform synonymous with Bitcoin perpetual swaps could be under the microscope of the U.S. regulator.
The CFTC is taking issue with the exchanges leader whom they accuse of among other things, money laundering and illegally “conducting significant aspects of its business from the U.S. and accepting orders and funds from U.S. customers.”
In all, the regulator is convinced Hayes and operators of the exchange are bad actors, acting out of their selfish interests, and are continuously skirt rules thereby gaining unfair advantage over those in the U.S. complying with their stringent laws.
All this is contrary to rules laid out by the Bank Secrecy Act.
A section of their civil enforcement action against BitMex read:
“Effective anti-money laundering procedures are among the fundamental requirements of intermediaries in the derivatives markets, whether in traditional products or in the growing digital asset market. This action shows the CFTC will continue to work vigilantly to protect the integrity of these markets.”
Bitcoin Price Analysis
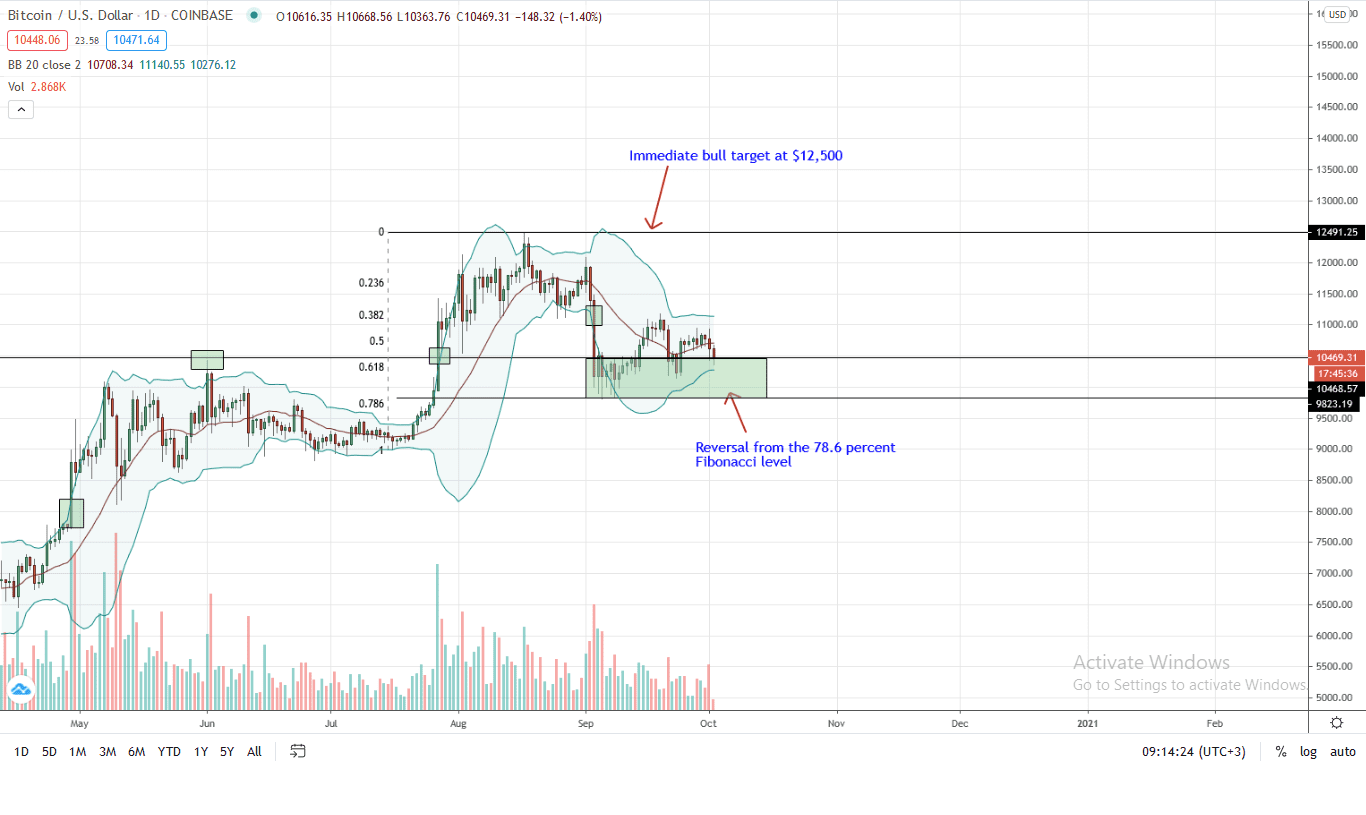
The Bitcoin price is still steady, waving above $10,000, losing grip versus the USD and ETH, shedding a ballpark two percent in the last trading week.
In the daily chart, candlestick arrangement suggest weakness. Technically, sellers are in control as long as prices trend below the $11,000 to $11,500 resistance level.
As it is, the BTC/USD price is oscillating inside Sep 21 and Sep 3 bear candlestick which had high trading volumes. Therefore, from volume analysis, sellers have the upper hand. This will be null once there is a sharp high-volume rally either above $11,500 (for aggressive bulls) or $12,000—for risk averse trader.
Conversely, losses below $10,000 and later $9,700 could see BTC prices disintegrate to $8,500 or worse confirming bears of early September.
Chart courtesy of Trading View
Disclaimer: Views and opinions expressed are those of the author. This is not investment advice. Do your research.
If you found this article interesting, here you can find more Bitcoin news