
Divergence: Prices and Activity
Here is a noteworthy observation: Bitcoin prices aren’t correlating with reported activity. Apparently, different reports indicate that the demand of Bitcoin is on the rise but unfortunately for buyers, that is yet to be translated into sharp, euphoria like gains this week.
While it doesn’t mean bulls have been squashed, candlestick arrangement and price action point to a “pause” of volatility.
Square App’s Bullish Report
Analysts are optimistic that such retreat in prices amid surges in trading volumes-readings from Bakkt Bitcoin Futures and Square App’s last report, are pointers of a possible breakout in coming days in not weeks.
Behind this reasoning are supportive technical candlestick formation, optimism around next year’s halving and events in China.
In the United States, there are nuggets that are indicative of accumulation. According to Jack Dorsey’s Square App, a whopping $343 million worth of BTC transactions were processed in Q3 2019.
From this figure, the public company generated $1.27 billion in revenue but most importantly, first time buyers more than doubled indicating that the processor is increasingly becoming a choice of investors seeking to invest in Bitcoin as a preferred digital asset.
In Q3 2018, Square App’s revenue stood at $43 million.
BTC/USD Price Analysis
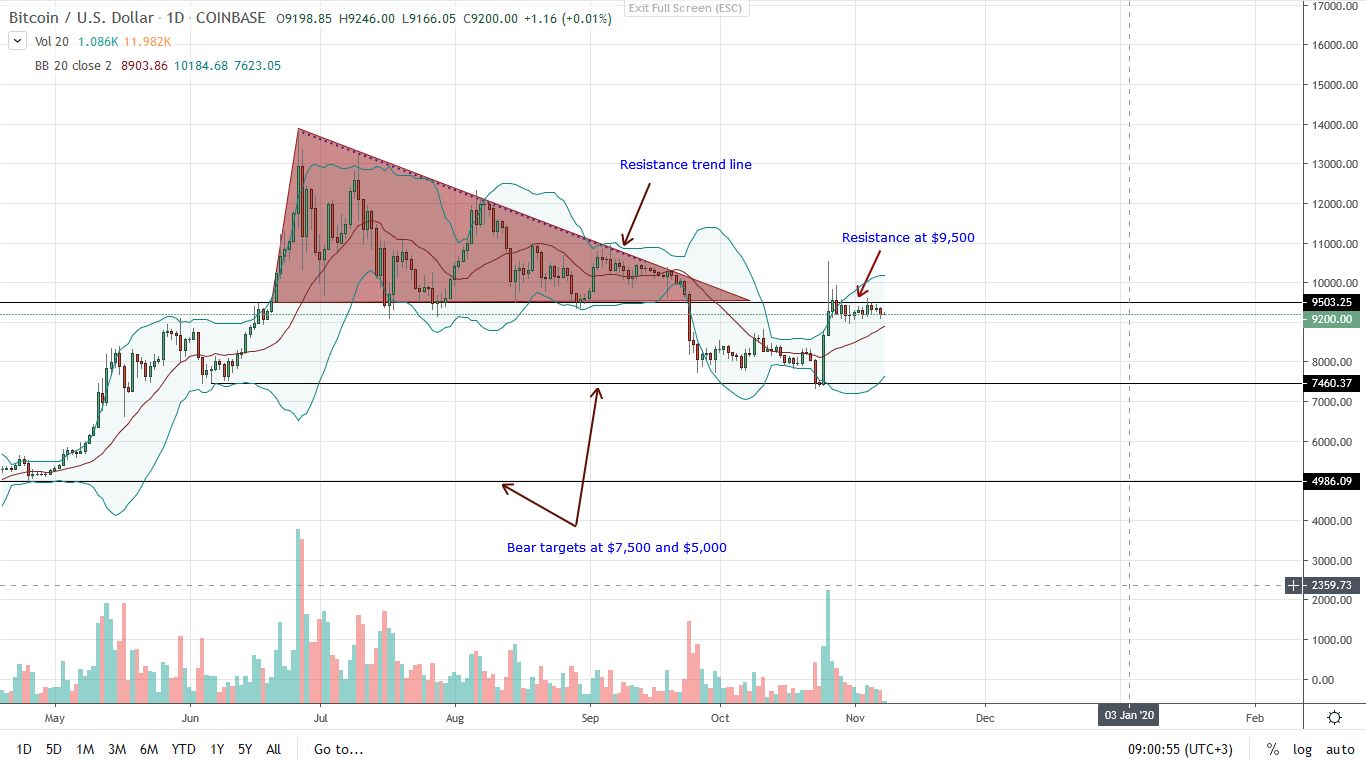
BTC is struggling to register decent gains against a resurgence green back. Week-to-date, the coin is flat and largely consolidating within Oct 26 high low.
Technically, bulls have an upper hand from an effort versus result point of view.
Based on the charts, risk-off, aggressive type of traders can buy the dips with fitting stop losses just below Oct 26 lows with modest targets anywhere between $10,500 and $11,000. If there is an uptick of trading volumes and prices break above the immediate resistance and round number of $10,000 propelled by high trading volumes exceeding those of Oct 26, then risk-averse, conservative traders can buy the breakout with first target at $11,000 and later $14,000.
The more prices consolidate, the stronger the expected breakout in either direction.
If for any reason there is a collapse below $8,600-$8,900 support zone, the above bullish overview will be null and void. In that case, traders can fade the current trend as BTC could end up dipping to $7,500 psychological support line before any decent development pans out.
Chart courtesy of TradingView – Coinbase
Disclaimer: Views and opinions expressed are those of the author and is not investment advice. Trading of any form involves risk. Do your research.