

Price AnalysisAnalysis
Bitcoin Upside Momentum Fades, BTC Retraces From $18.5k
Bitcoin is down roughly five percent from this week's high, recoiling from a critical resistance level at $18.5k.


Bitcoin is down approximately six percent from this week’s high, falling at the back of new FED developments.
Even though traders are bullish and BTC is technically within a bullish formation after gains of December 13, the coin looks fragile.
Day open
$17,356
00:00 UTC
Past 7 days
+0.8%
from $17,224
Since the open
+274%
$64,883 · 16 Nov, 18:55 UTC
Record close
−74.3%
$67,526 · Nov 2021
For a clear trend definition, there must be a solid gain above $18.5k, away from the current consolidation with primary support at $17.5k.
As it is, BTC may fall lower, completing the three-bar bearish formation of December 13 through 15, even possibly reversing gains of early this week.
In that eventuality, serious concerns could arise regarding the strength of the uptrend. At the same time, there will be doubts about whether BTC can shake off determined sellers of the last trading year.
The FED Effect
The dump of BTC is primarily due to the U.S. Federal Reserve (FED) outlook for 2023. Earlier, inflation readings in the U.S. fell, forcing Bitcoin higher since analysts were confident the period of a heated economy was coming to an end.
However, the FED raised rates to 4.5 percent on December 14. According to their forecast, the FED added that next year, inflation could rise and unemployment levels rise as the economy continues to feel the effect of COVID interventions.
Lyn Alden, the founder of Lyn Alden Investment Strategy, remains positive, saying BTC can, despite falling valuations, stabilize in 2023.
“Going forward into 2023, I think a slowdown in corporate earnings, rather than valuation compression, will likely keep pressure on equities while potentially allowing monetary assets such as Bitcoin and precious metals to stabilize.”
Bitcoin Price Analysis
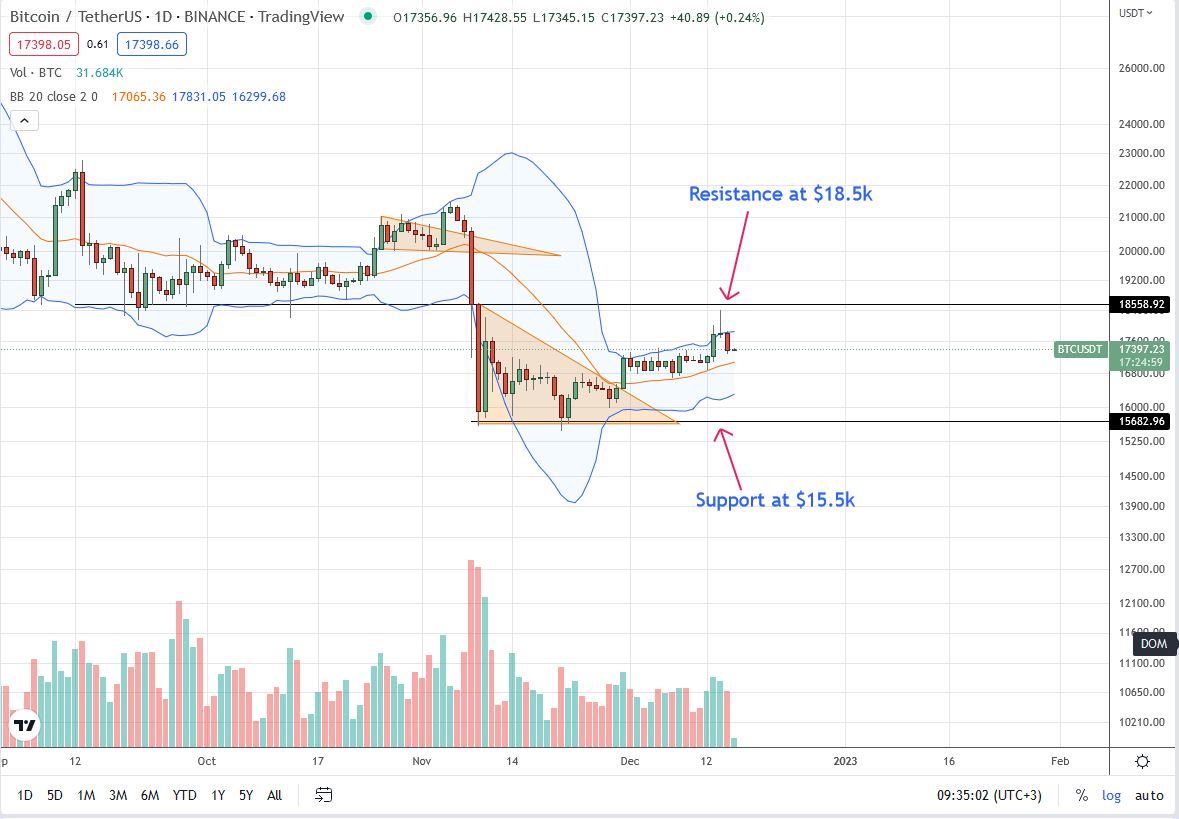
Based on the daily chart, BTC is down six percent and under pressure in a broader bearish formation from a top-down one. The pin bar of December 14 was followed by lower lows yesterday, pointing to weakness. If sellers of December 15 flow back, BTC may crumble below $17.5k to $17k, disqualifying bulls and canceling the bullish outlook following the break above the bear flag.
Still, because BTC prices are inside the December 13 bull bar, aggressive traders can buy the dips, targeting $18.5k in the short term. Losses below $17k will cancel this preview, allowing sellers to flow back, possibly forcing the coin toward $16.5k in the short term.
Conservative traders can wait for clear trend definitions, either above $18.5k or below $15.5k.
Technical charts courtesy of Trading View.
Disclaimer: Opinions expressed are not investment advice. Do your research.
If you found this article interesting, here you can find more Bitcoin news.
Notice. For information only; not investment advice.


