The Bitcoin price rose to $39.6k on Jan 7, adding an incredible $4,500. A gain and a level that Bitcoin sunk to in March 2020. That was nine months ago.
Since then, the Bitcoin price expansion has been spectacular. Price rallies have been dizzying, and for traders, the best strategy is to hold. Tactically buying low and selling high, at this pace, doesn’t just cut it.
The Bitcoin Double Pump?
Analysts are even expecting more. According to Willy Woo, an on-chain analyst specializing in Bitcoin, whales are spawning in large numbers.
Coincidently, the uptick not only in Bitcoin prices but addresses and other interesting metrics like miner revenue in the past three months or so, since H2 2020, continues to rise. As of today, the Bitcoin hash rate is at an all-time high, above 161 EH/s.
In his view, the Bitcoin price is ready for a double pump. Behind this is a surge in the number of $1 million+ orders from family offices and institutions who are rushing in for exposure.
Their influx, the analyst said, gives Bitcoin and crypto validation. Combined with other fundamentals, it means the BTC/USD price can from spot rates jump to $80k or better in coming sessions.
Institutional Deluge
After years of retail pumps, they have been relegated to mere watchers as institutional money flow in, causing a deluge of interest that has consequently doubled prices a few days after the all-time high of $20k was hit.
At around $38k, the Bitcoin price has nearly doubled and on course of registering more highs, perhaps to $41k and $50k in the medium term.
Bitcoin Price Prediction
The BTC/USD price is up 33 percent in the last week of trading.
At over $38.2k, the path of least resistance is northwards. Already, BTC is exceeding expectations. The reversal from the 78.6 percent Fibonacci extension level would, historically, see prices retest 2017 highs. However, the rapidity of the breakout coupled with fundamental factors funneled institutional interest, reinvigorating buyers.
Accordingly, for traders, every low can technically be a loading opportunity.
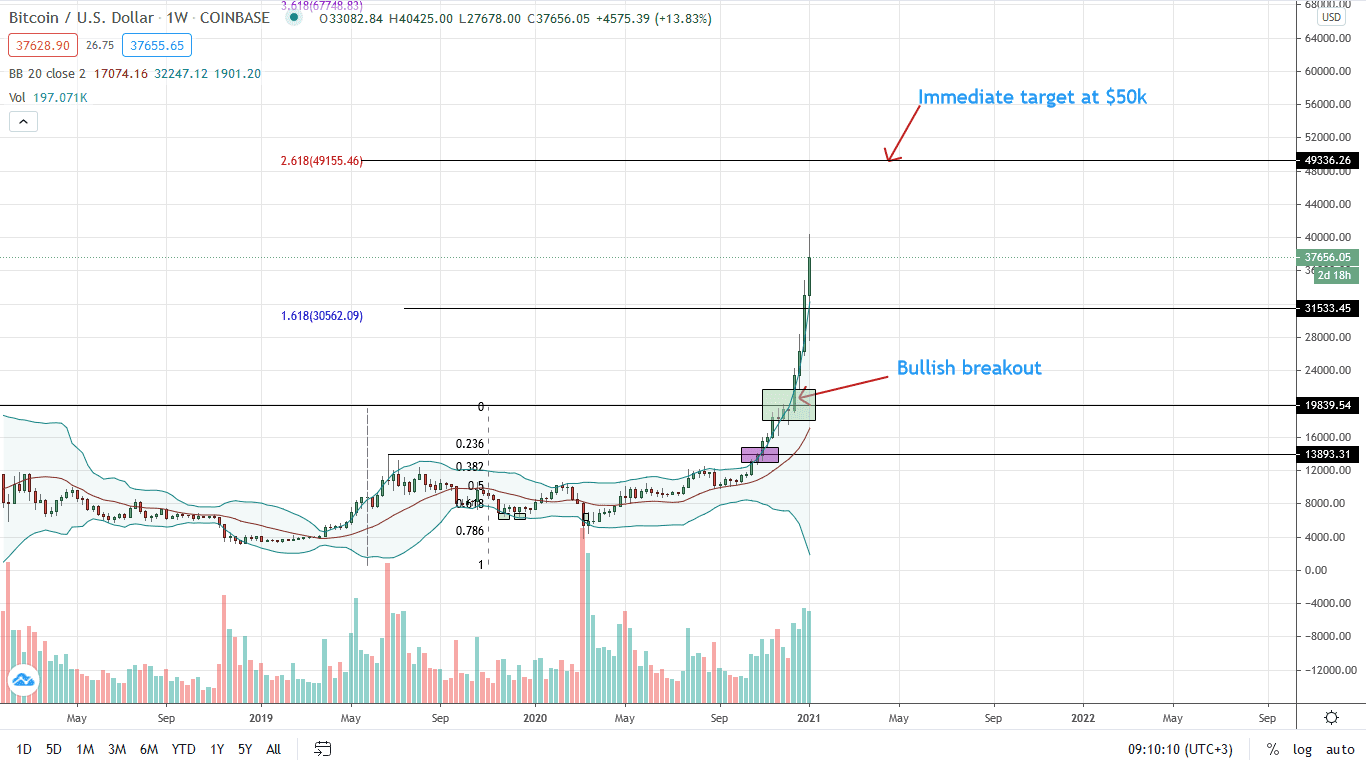
From the price chart, the immediate support is $31k, the 1.618 percent Fibonacci extension level of the 2017 trade range.
Considering the rapid expansion of the BTC/USD price, the next bull target is $50k, the 2.618 percent Fibonacci extension.
Technical candlestick arrangement points to strong bullish momentum. Data shows that Bitcoin trading volumes rose seven percent in the last day to $70 billion.
With diverging BB and candlesticks aligning along the upper BB, buyers are in the driving seat.
Chart courtesy of Trading View
Disclaimer: Opinions expressed are not investment advice. Do your research.
If you found this article interesting, here you can find more Bitcoin news