

Selling pressure has stormed the cryptocurrency market as it drifted back to the lower levels and flashed red. Bitcoin and the rest of the cryptocurrencies are in no mood to break free from its tight consolidation range yet. Polygon [MATIC], Chainlink [LINK], and Solana [SOL] also invalidated bullish cues with the latest correction.
Polygon: Bears continue to anchor MATIC
Polygon [MATIC] was trading near the May levels. The latest bearish pressure slashed its gains which resulted in a weekly decline of roughly 12%. Its price rebound after June low has been impressive. However, the digital asset failed to maintain the necessary momentum. Over the past day, MATIC was down by 3.89% which drove its price to $0.987. With a market cap of $6.27 billion, it recorded a 24-hour trading volume of $453 million.
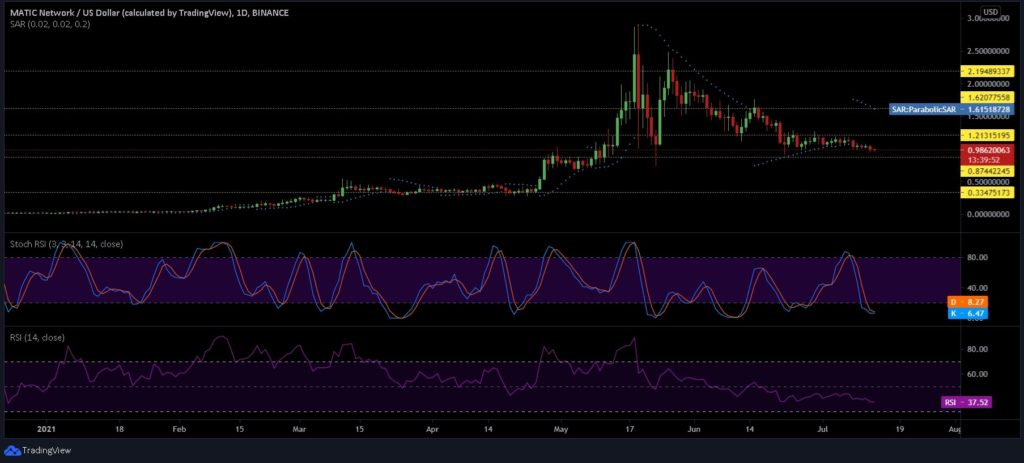
As the price depreciated slowly, the dotted markers of the Parabolic SAR shifted above the MATIC price candles. The Stochastic RSI is on the verge of a bearish crossover in the extreme oversold region which could mean a reversal to the upside could be in the cards. However, the RSI did not depict a similar sentiment. In fact, it indicated the rising sell pressure as it turned away from the half-line.
MATIC needs to breach the immediate level of resistance at $1.21 to be able to aim big and target other crucial resistance areas of $1.62, and $2.19. On the other hand, the support area for the coin stood at $0.87, and $0.33 respectively.
Chainlink: LINK in the need for credible support
Chainlink [LINK] prices remained on the lower side as it extended its weekly losses to 7.84%. The crypto-asset was currently priced at $17.69 while sitting at a market cap of $617 billion.
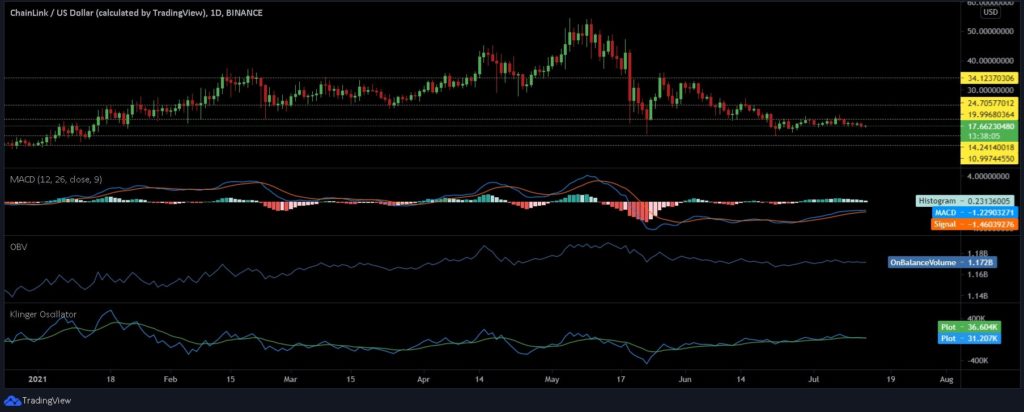
LINK broke a key support region this week. The price of the crypto-asset registered an oversold reading on the daily MACD which was at the cusp of a bearish crossover. The OBV indicator has been pretty consistent and has declined slightly after the mid-May fall. Additionally, the Klinger Oscillator [KO] sustained a bearish crossover.
Bears clearly have the upper hand in LINK’s market which could push the token to another level of support at $14.24. If the bulls fail to defend this level, the digital asset risks decline to a low of $10.9. On the flip side, the resistance levels were found to be at $19.9, $24.7, and $34.12 respectively.
Solana: SOL risks testing May lows?
Solana [SOL] is probably one of the few crypto-assets that is yet to test or undercut May lows. However, SOL has been forming lower highs of late which could prove to be a major cause of concern.
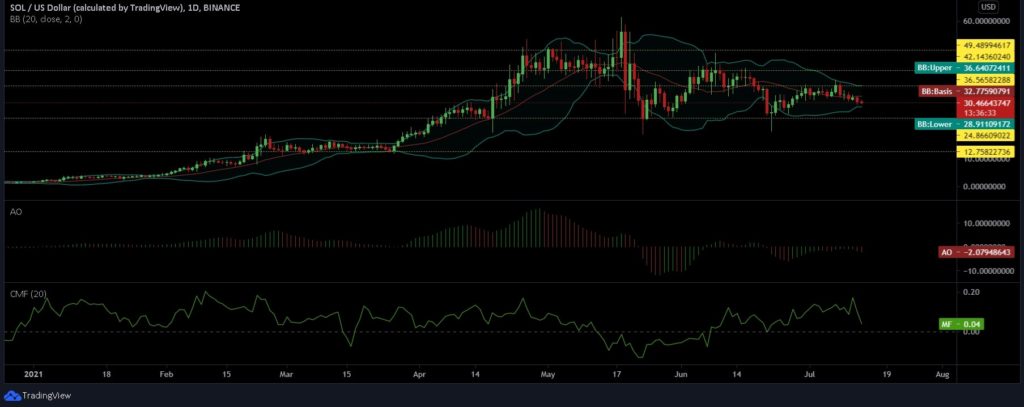
The squeezing Bollinger Bands indicated that the price volatility for SOL may remain low over the next trading sessions. The red closing bar of Awesome Oscillator [AO] did not depict a promising momentum in the coin market. Similarly, the Chaikin Money Flow [CMF] also noted a steep decline as the prices fell suggesting a rise in the capital outflow.
First level of resistance stood at the recently established local high of $36.56, while other target points were at $42.14, and $49.4 respectively. Besides, the support level stood untested at $24.86, and $12.75 respectively.
If you found this article interesting, here you can find more Blockchain and cryptocurrency news


